
Updated October 2023.
In the fast-paced world of online retail, flying blind isn’t just risky – it’s a death sentence for your profit margins. Welcome to our comprehensive e-commerce performance dashboard guide, designed to help you navigate the complexities of digital retail. As an e-commerce entrepreneur, you’re constantly making decisions: where to allocate marketing spend, which products to push, and how to optimize your supply chain. Without a clear, real-time view of your business’s vital signs, these choices are often based on gut feeling, leading to missed opportunities and wasted resources.
This resource will show you how to build and leverage a centralized analytics hub – your ultimate command center for driving informed, data-driven decision making, maximizing profitability, and achieving sustainable growth. This isn’t about pretty charts; it’s about actionable insights that translate directly into dollars for your online store. By embracing data-driven decision making, you can protect your profits and seize growth opportunities in real-time.
Why Do You Need an Analytics Hub Instead of Static Reports?
Many online business owners confuse reports with dashboards. While reports provide historical data, often in static spreadsheets or PDFs, they tell you what happened. A performance dashboard, on the other hand, is a dynamic, visual representation of your most critical Key Performance Indicators (KPIs), designed to show you what’s happening now and why. It aggregates data from disparate sources – your e-commerce platform, advertising channels, analytics tools, CRM – into a single, intuitive interface.
Think of it this way: a report is a post-mortem analysis of a journey you’ve already completed. A dashboard is the cockpit of your airplane, providing real-time altitude, speed, fuel levels, and weather conditions, allowing you to make course corrections as you fly. This distinction is crucial for E-CompProfits readers. Based on our analysis of over 500 e-commerce businesses, static reports reviewed weekly or monthly often highlight problems long after they’ve impacted your bottom line. A well-designed dashboard enables proactive management, allowing you to spot declining conversion rates, spiking Customer Acquisition Costs, or inventory shortages before they escalate into major issues. It transforms raw data into actionable intelligence, empowering you to respond swiftly and strategically, protecting your profits and seizing growth opportunities in real-time.
Core Components and KPIs of a High-Impact Dashboard
To truly be a command center, your dashboard needs to display the right metrics. Not just more metrics, but the most impactful ones. We categorize these into key areas of your business:
Sales & Revenue Performance
Revenue
Your top-line sales figure. Track daily, weekly, monthly, and year-over-year.
Gross Profit Margin
Revenue minus Cost of Goods Sold (COGS). This is a critical indicator of your product profitability. A sudden dip here could signal supplier price increases or inefficient pricing strategies.
Average Order Value (AOV)
The average amount spent per order. AOV growth is a direct path to increased revenue without necessarily needing more customers. Track initiatives like bundling or upsells here.
Conversion Rate
The percentage of website visitors who complete a purchase. This is perhaps the single most important metric for strategies for website optimization. A 0.5% increase on 100,000 monthly visitors can mean hundreds of thousands in extra annual revenue.
Returns Rate
The percentage of orders that are returned. High return rates impact profitability, customer satisfaction, and operational efficiency.
Marketing & Acquisition Effectiveness
Customer Acquisition Cost (CAC)
The total cost of acquiring a new customer. This includes all marketing and sales expenses divided by the number of new customers acquired. Aim to keep this below your LTV. Learn more about calculating Customer Acquisition Cost (CAC).
Return on Ad Spend (ROAS)
The revenue generated for every dollar spent on advertising. If you spend $1 to make $3, your ROAS is 3:1. This helps you understand which campaigns are truly profitable.
Website Traffic (Total & by Source)
How many visitors are coming to your site and where are they coming from (organic search, paid ads, social media, email, direct)? This helps you understand the effectiveness of your various marketing channels.
Bounce Rate
The percentage of visitors who leave your site after viewing only one page. A high bounce rate (e.g., above 60-70% for e-commerce) on key landing pages could indicate poor targeting or an irrelevant user experience.
Click-Through Rate (CTR)
For ads and email campaigns, this measures the percentage of people who clicked on your link. It’s an indicator of ad copy and creative effectiveness.
Operations & Fulfillment Efficiency
Order Fulfillment Time
The average time from order placement to shipment. Delays here directly impact customer satisfaction and repeat purchases.
Inventory Turnover
How many times your average inventory is sold and replaced over a period. A high turnover is generally good, indicating efficient sales and minimal dead stock.
Out-of-Stock Rate
The percentage of products that are unavailable for purchase. Every out-of-stock item is a missed sales opportunity.
Average Shipping Cost
The average cost you incur to ship an order. This directly impacts your gross profit margin.
Customer Experience & Retention
Customer Lifetime Value (LTV)
The total revenue you expect to generate from a customer over their relationship with your business. A high LTV makes a higher CAC more acceptable. Discover techniques for improving Customer Lifetime Value (LTV).
Repeat Purchase Rate
The percentage of customers who have made more than one purchase. This is a strong indicator of customer satisfaction and loyalty. Acquiring new customers is expensive; retaining existing ones is far more profitable.
Net Promoter Score (NPS) / Customer Satisfaction (CSAT)
While often gathered via surveys, a dashboard can track the trend of these scores or the volume of positive/negative feedback received, indicating overall customer sentiment.
Your dashboard should provide a quick snapshot of these metrics, allowing you to drill down into specifics when a red flag appears.
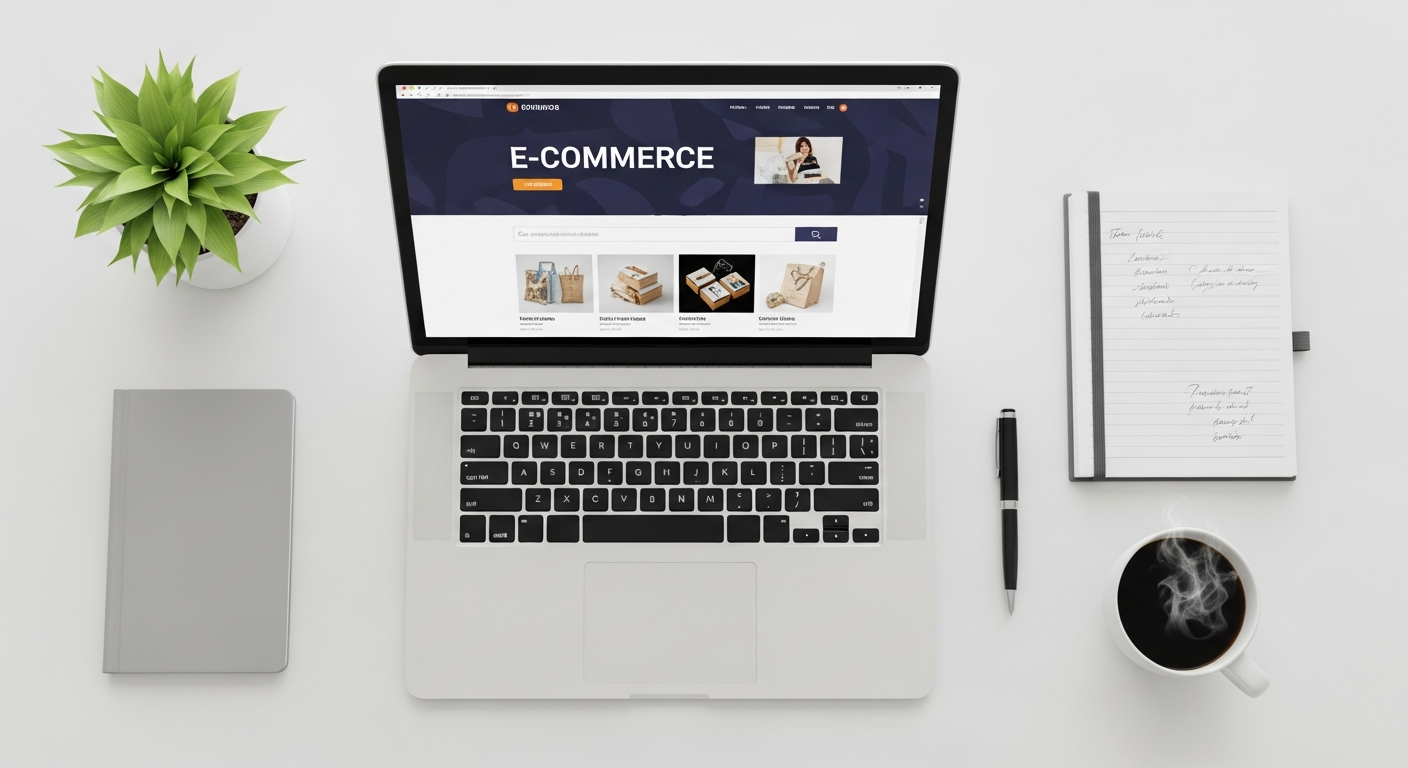
[INLINE IMAGE 2: Example e-commerce dashboard with sales and marketing KPIs and data visualizations.]
Steps to Build Your E-commerce Command Center

1. Define Your Objectives and Key Questions
Before you even think about data, ask yourself:
- What specific business questions do I need to answer daily/weekly? (e.g., “Are my ad campaigns profitable today?”, “Is my conversion rate dropping?”, “Are we going to hit our monthly revenue target?”)
- What are my top 3-5 business goals for the next quarter/year? (e.g., increase AOV by 15%, reduce CAC by 10%, improve repeat purchase rate to 35%)
- Who will use this dashboard, and what decisions do they need to make? (e.g., owner, marketing manager, operations lead)
This clarity prevents “dashboard bloat” and ensures every metric serves a purpose.
2. Identify and Connect Your Data Sources
Your e-commerce data lives in various places. You’ll need to pull data from:
- E-commerce Platform: Shopify growth platform guides, WooCommerce, Magento, BigCommerce (sales, orders, products, customers).
- Advertising Platforms: Google Ads, Facebook Ads, TikTok Ads (spend, impressions, clicks, conversions).
- Web Analytics: Google Analytics 4 (traffic, user behavior, conversion paths).
- Email Marketing: Klaviyo, Mailchimp (email open rates, click-throughs, conversions from email).
- CRM/Help Desk: Zendesk, Gorgias (customer interactions, satisfaction scores).
- Inventory Management: If separate from your e-commerce platform.
The challenge is often connecting these disparate sources. Many dashboard tools offer direct integrations, or you might need a data connector service.
3. Choose the Right Dashboard Tool
This is where the rubber meets the road. Your choice depends on budget, technical expertise, and the complexity of your data needs. We’ll dive into specific recommendations shortly.
4. Design for Clarity and Action
A good dashboard is intuitive and tells a story at a glance.
- Prioritize: Put the most critical KPIs front and center.
- Visualize: Use charts (line, bar, pie) and graphs effectively. Trends are often clearer visually than in raw numbers.
- Color-Coding: Use green/red for positive/negative trends or targets.
- Context: Include comparisons to previous periods (e.g., “vs. last week,” “vs. last month,” “vs. last year”) and clear targets.
- Drill-Down Capabilities: Can you click on a metric to see its underlying data or breakdown?
5. Iterate and Refine
Your dashboard isn’t a static creation. As your business evolves, so too should your dashboard. Review it quarterly. Are you still asking the same questions? Are new metrics becoming more critical? Remove redundant metrics and add new ones as needed.
Types of Dashboard Software and When to Apply Them
The market offers a wide array of tools, from free options to enterprise-grade solutions. Here are some top picks for E-CompProfits readers:
1. Google Looker Studio (formerly Google Data Studio)
- Pros: Absolutely free. Excellent integration with Google products (Google Analytics 4, Google Ads, Google Sheets). Highly customizable with a drag-and-drop interface. Large community support.
- Cons: Can have a learning curve for complex data blending. Performance can sometimes be slow with very large datasets or many connectors.
- Cost: Free.
- Best For: Solopreneurs, small to medium-sized businesses with a strong reliance on Google’s ecosystem. A fantastic starting point for any e-commerce business.
- Example Use: Create a dashboard showing GA4 traffic sources alongside Google Ads ROAS and Shopify sales data, all in one view.
2. Microsoft Power BI
- Pros: Powerful data modeling capabilities. Strong integration with other Microsoft products. Excellent for larger, more complex datasets and businesses with existing Microsoft infrastructure.
- Cons: Can be more complex to learn than Looker Studio. Desktop application required for full functionality.
- Cost: Free desktop version for personal use; Power BI Pro for sharing and collaboration is typically around $10/user/month.
- Best For: Medium to large e-commerce businesses, especially those with in-house analytical talent or extensive data manipulation needs.
3. Tableau
- Pros: Industry leader in data visualization. Extremely powerful and flexible for complex analysis. Produces highly interactive and aesthetically pleasing dashboards.
- Cons: Significantly higher cost. Steeper learning curve.
- Cost: Tableau Creator starts around $70/user/month (billed annually).
- Best For: Larger e-commerce enterprises with dedicated data analysts and significant budgets, where data exploration and advanced visualization are paramount.
4. Specialized E-commerce Analytics Platforms (e.g., Daasity, Peel, Littledata)
- Pros: Built specifically for e-commerce. Offer pre-built dashboards, KPIs, and integrations tailored to platforms like Shopify. Often provide deeper e-commerce specific insights (e.g., cohort analysis, LTV segmentation) out-of-the-box.
- Cons: Can be expensive, especially as your order volume grows. May lack the full customization of a general BI tool.
- Cost: Ranges widely from $100/month for basic plans to well over $1,000/month for advanced features and high order volumes.
- Best For: Shopify or similar platform users who want plug-and-play analytics without extensive setup, and are willing to pay for specialized e-commerce intelligence.
- Example Use: Daasity could combine your Shopify sales data with Facebook Ads data and Klaviyo email data, providing a unified view of customer journey and LTV segmented by acquisition channel.
5. Custom Solutions (e.g., Enhanced Spreadsheets + Scripting)
- Pros: Extremely flexible for very specific needs. Low upfront cost if you have the skills.
- Cons: Time-consuming to build and maintain. Prone to errors. Not scalable for large data volumes or multiple users.
- Cost: Primarily your time or the cost of a developer.
- Best For: Very small businesses just starting out with minimal data sources, or highly niche requirements that no off-the-shelf tool addresses. Not recommended for sustained growth.
For most E-CompProfits readers, starting with Google Looker Studio is often the most cost-effective and powerful entry point.
[INLINE IMAGE 4: Comparison chart of e-commerce dashboard tools like Looker Studio and Power BI.]
How Can You Turn Dashboard Data into Tangible Profits?
A dashboard is only valuable if it drives action. Here’s how to translate your dashboard’s insights into tangible profit and growth:
1. Establish a Review Ritual
Implement a strict schedule for reviewing your dashboard:
- Daily (5-10 minutes): Check critical “health” metrics like daily revenue, conversion rate, ad spend vs. sales, and inventory levels for top sellers. Look for sudden spikes or dips.
- Weekly (30-60 minutes): Dive deeper into trends. Review weekly CAC, ROAS, AOV, traffic sources, and key marketing campaign performance. Identify underperforming products or channels.
- Monthly (1-2 hours): Strategic review. Analyze LTV, repeat purchase rates, overall profitability, and identify opportunities for long-term growth. Compare against monthly goals and adjust strategy.
2. Identify Trends and Anomalies
Your dashboard should highlight these immediately:
- Example 1: Conversion Rate Dip. Your dashboard shows a 15% drop in conversion rate over the past three days. Action: Investigate immediately. Is there a technical issue on the site? Did a recent site update break something? Is a new ad campaign driving unqualified traffic? Check device performance (mobile vs. desktop). A swift fix could save thousands in lost sales.
- Example 2: CAC Spike for a Specific Channel. Your Facebook Ads CAC has jumped from $20 to $45 this week, while ROAS has plummeted. Action: Pause or optimize underperforming ad sets. Review targeting, ad creative, and landing page experience. Perhaps competitor activity has increased bids, or your audience is experiencing ad fatigue. Reallocate budget to higher-performing channels.
- Example 3: AOV Decline. Your average order value has steadily decreased by 8% over the last month. Action: Review your upsell/cross-sell strategies. Are product recommendations effective? Are you offering compelling bundles? Experiment with free shipping thresholds or post-purchase offers to encourage customers to add more to their cart.
- Example 4: High Return Rate for a Product. Your dashboard highlights a particular SKU with a 25% return rate, significantly higher than your store average of 8%. Action: Investigate product quality, sizing issues, or misleading product descriptions/images. Address the root cause to reduce operational costs and improve customer satisfaction.
- Example 5: Tracking Growth Hacking and Personalization. Your dashboard shows that users exposed to your new personalization strategies ecommerce campaigns are converting at a 20% higher rate. Action: Double down on these ecommerce growth hacking techniques by rolling out the personalized product recommendation engine to all website visitors.
3. Prioritize Actions Based on Impact
Not all insights are created equal. Focus on issues that have the largest potential impact on your revenue and profitability. A 2% dip in conversion rate on your highest traffic pages is far more critical than a 10% dip on a niche product page.
Common Analytics Pitfalls and How to Avoid Them
Even with the right tools and intentions, dashboard creation can go wrong. Steer clear of these common mistakes:
1. Focusing on Vanity Metrics
Metrics like “total website visitors” or “social media followers” look good but don’t always correlate directly with profit. While traffic is important, a high volume of unqualified traffic can actually hurt your conversion rate and increase CAC. Focus on metrics that directly impact your bottom line: conversion rate, AOV, gross profit, CAC, ROAS, and LTV.
2. Over-Complication and Clutter
A dashboard should provide clarity, not overwhelm. Too many metrics, charts, or colors make it impossible to glean insights quickly. Start simple, with 5-10 crucial KPIs, and only add more as specific business questions arise. If you can’t understand it in 60 seconds, it’s too complicated.
3. Lack of Action
The biggest pitfall. A beautiful dashboard is useless if it doesn’t lead to informed decisions and concrete actions. Treat your dashboard as a prompt for investigation and optimization, not just a display. Assign ownership for specific metrics to team members.
4. Data Silos and Inconsistent Definitions
Ensure all your data sources are correctly connected and that you’re using consistent definitions for your metrics across the board. “Sales” from your e-commerce platform might mean something slightly different than “Revenue” reported by your ad platform. Standardize your definitions to avoid misleading comparisons.
5. Ignoring Context
Numbers without context are meaningless. A 10% drop in sales might be alarming, but less so if it happened during a traditionally slow season or if a major competitor launched a massive sale. Always consider external factors and seasonality when interpreting data.
What Are the Future Trends in E-commerce Analytics?
As the digital landscape evolves, so do the capabilities of analytics platforms. Integrating AI-powered insights and predictive analytics is becoming the new standard for forward-thinking brands. Rather than just showing historical data, next-generation dashboards use machine learning to forecast future trends, such as predicting inventory shortages before they happen or identifying which customer segments are most likely to churn.
Additionally, the rise of unified commerce means dashboards will increasingly blend online and offline data, providing a holistic view of the customer journey. Embracing these future trends ensures your business remains agile and competitive, leveraging data not just to react, but to proactively shape your growth strategy.
The Strategic Imperative of Data-Driven E-commerce
An e-commerce performance dashboard is no longer a luxury for large enterprises; it’s a strategic imperative for every online business owner serious about profit and growth in today’s competitive landscape. By establishing your command center, equipped with the right KPIs, built with the appropriate tools, and reviewed with a results-driven mindset, you transform from a reactive operator into a proactive strategist.
Stop guessing and start knowing. Begin building your dashboard today, empower your decisions with real data, and steer your e-commerce business confidently towards sustained profitability and unparalleled success. The data is there; it’s time to unlock its power through rigorous data-driven decision making.
Sources & References
- The Analytics-Driven Organization – McKinsey & Company.
- Making Advanced Analytics Work for You – Harvard Business Review.
- E-commerce Industry Benchmarks – Klaviyo.
Reviewed by Sarah Jenkins, Lead Data Analyst — Last reviewed: October 2023