
Mastering E-commerce Profitability: A Comprehensive Guide on How to Calculate Conversion Rate for D2C Success
Affiliate disclosure: This article may contain affiliate links. Recommendations are independent and editorially driven.
In the dynamic world of direct-to-consumer (D2C) e-commerce, success isn’t just about driving traffic; it’s about making that traffic count. Every click, every visit, every interaction holds the potential for a sale, an email signup, or a deeper engagement with your brand. The bridge between potential and realized value is often measured by a single, critical metric: the conversion rate. Understanding how to calculate conversion rate and, more importantly, how to improve it, is foundational to sustainable growth and robust profitability for any online store.
For D2C brands, where every marketing dollar and every operational decision directly impacts the bottom line, optimizing the conversion rate isn’t merely a best practice—it’s an imperative. It allows you to transform existing website visitors into customers more efficiently, squeezing more value out of your current traffic without necessarily increasing your ad spend. This guide will demystify conversion rates, provide you with the exact formulas and methodologies to calculate them accurately, and equip you with advanced strategies to drive significant improvements across your e-commerce operations. By the end, you’ll not only know how to calculate conversion rate, but you’ll also possess a strategic framework for turning data into unparalleled D2C growth.
Understanding the Fundamentals: What is Conversion Rate?
Before diving into the mechanics of how to calculate conversion rate, it’s essential to grasp what this metric truly represents within the e-commerce landscape. At its core, a conversion rate is the percentage of your website visitors who complete a desired action. This “desired action” isn’t always a purchase; it can vary widely depending on your business goals and the specific page or campaign you’re evaluating.
Defining Conversion and Rate in E-commerce
A “conversion” in e-commerce refers to any action a user takes on your website that aligns with your business objectives. While the ultimate goal for most e-commerce sites is a sale (a macro-conversion), there are numerous smaller, incremental actions that contribute to the customer journey (micro-conversions).
- Macro-conversions: These are the primary, most valuable actions. For an e-commerce store, this almost always means a completed purchase.
- Micro-conversions: These are smaller steps that indicate user engagement and often lead towards a macro-conversion. Examples include:
- Signing up for an email newsletter
- Adding a product to the cart
- Adding a product to a wishlist
- Viewing a product video
- Downloading a lookbook or guide
- Starting a live chat session
- Reaching a specific number of page views
The “rate” simply expresses how frequently these desired actions occur relative to the total number of opportunities (typically website visitors or sessions). It’s a powerful indicator of your website’s effectiveness in guiding users towards your business goals.
Why Conversion Rate Matters for E-commerce & D2C Brands
For D2C brands operating in a competitive digital marketplace, the conversion rate isn’t just another vanity metric. It’s a direct reflection of your business’s health and potential for growth. Here’s why it’s so critically important:
- Direct Impact on Revenue: A higher conversion rate means more sales from the same amount of traffic. This directly translates to increased revenue without needing to spend more on customer acquisition.
- Optimizing Marketing Spend: If you’re investing heavily in advertising to drive traffic, a low conversion rate means you’re effectively wasting a portion of that budget. Improving conversion ensures a better return on your marketing investment (ROI).
- Enhanced Profitability: By generating more sales from existing traffic, you reduce your effective customer acquisition cost (CAC). This directly boosts your profit margins, allowing for reinvestment into product development, marketing, or infrastructure.
- Scalability and Sustainable Growth: Brands with optimized conversion funnels can scale more efficiently. Each new visitor has a higher probability of becoming a customer, making growth more predictable and sustainable.
- Improved User Experience (UX): Efforts to improve conversion rates naturally lead to a better, more intuitive, and frictionless experience for your users. This fosters customer loyalty and positive brand perception.
- Competitive Advantage: In a crowded D2C space, even a marginal increase in conversion rate can provide a significant edge over competitors who are not as focused on optimization.
The Economic Imperative: More Sales, Lower Costs
Consider two D2C brands, both spending $10,000 per month on advertising to drive 50,000 visitors to their respective websites. Brand A has a conversion rate of 1%, while Brand B has optimized theirs to 2%.
- Brand A: 50,000 visitors * 1% conversion = 500 sales
- Brand B: 50,000 visitors * 2% conversion = 1,000 sales
Brand B generates double the sales with the exact same marketing spend. This isn’t just about more revenue; it significantly impacts their customer acquisition cost and overall profitability. If the average order value (AOV) is $100, Brand B generates an additional $50,000 in revenue without any additional marketing outlay for traffic. This stark difference underscores why mastering how to calculate conversion rate and then actively optimizing it is not just beneficial, but absolutely essential for thriving in e-commerce.
The Essential Formula: How to Calculate Conversion Rate
Now that we understand the ‘what’ and ‘why,’ let’s get to the ‘how.’ Calculating your conversion rate is straightforward, relying on a simple, yet powerful, mathematical formula. This formula can be applied universally across various conversion types, offering clarity on your performance.
The Basic Conversion Rate Equation
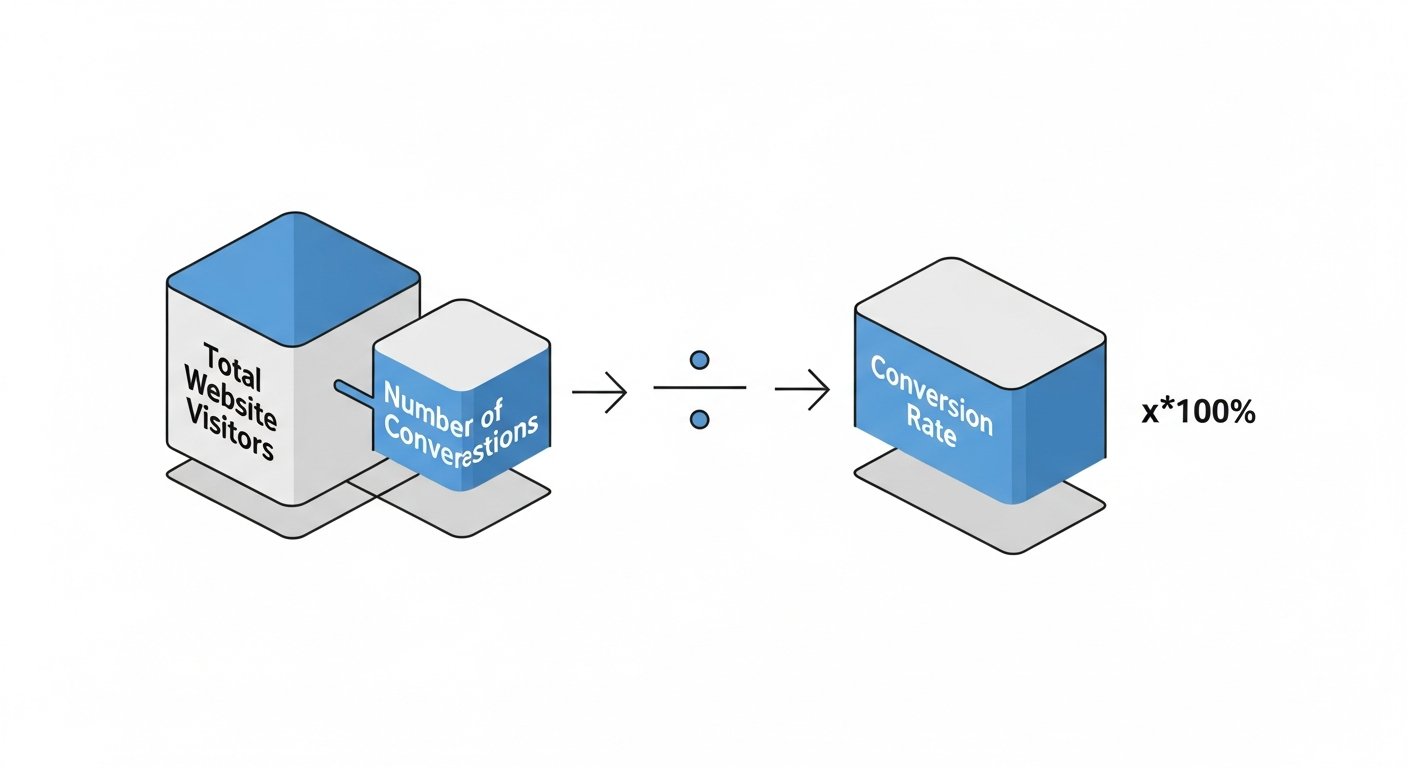
The fundamental formula for calculating conversion rate is:
Conversion Rate = (Number of Conversions / Number of Visitors) * 100
- Number of Conversions: This refers to the total count of desired actions completed within a specific time frame. For an e-commerce store, this is most commonly the total number of orders placed. However, it can also be the number of newsletter sign-ups, add-to-cart events, or any other micro-conversion you are tracking.
- Number of Visitors: This represents the total number of unique individuals who visited your website (or a specific page/section) within that same time frame. It’s crucial to distinguish between “visitors” (often measured as “users” in analytics platforms) and “sessions.” A single user can have multiple sessions, and sometimes using “sessions” as the denominator might make more sense depending on what you’re trying to measure. For overall site conversion, “users” is generally preferred to avoid double-counting repeat visits from the same person for a single conversion goal.
- * 100: We multiply by 100 to express the result as a percentage, which is the standard format for conversion rates.
Step-by-Step Calculation Guide
Let’s break down the process with a practical example to make it crystal clear:
- Define Your Conversion Goal: What specific action are you tracking? For this example, let’s say we want to calculate the overall purchase conversion rate for an e-commerce store.
- Choose Your Time Period: Select a specific duration for your analysis (e.g., a day, a week, a month, a quarter). Consistency is key here. Let’s use the last month.
- Gather Your Data: Access your analytics platform (e.g., Google Analytics, Shopify Analytics) to find the relevant numbers for your chosen time period.
- Number of Conversions: Let’s say your store recorded 1,500 completed purchases last month.
- Number of Visitors: Let’s say your store had 75,000 unique users (visitors) last month.
- Apply the Formula: Plug these numbers into the conversion rate formula.
Conversion Rate = (1,500 purchases / 75,000 visitors) * 100Conversion Rate = 0.02 * 100Conversion Rate = 2%
In this example, your e-commerce store achieved a 2% conversion rate for purchases last month. This means that for every 100 unique visitors, 2 of them made a purchase.
Practical Examples for Different Scenarios
The beauty of this formula is its versatility. You can apply it to various scenarios to gain granular insights:
Example 1: Product Page Conversion Rate
You want to see how effective a specific product page is at converting visitors into adding the item to their cart.
- Goal: Add to Cart
- Time Period: Last week
- Data:
- Number of “Add to Cart” clicks on Product X: 250
- Number of unique visitors to Product X page: 5,000
- Calculation:
Product X Add-to-Cart Rate = (250 / 5,000) * 100 = 5%
This tells you that 5% of visitors to that particular product page are adding the item to their cart.
Example 2: Email Signup Conversion Rate
You want to measure the effectiveness of your pop-up or banner promoting newsletter sign-ups.
- Goal: Email Signup
- Time Period: Last month
- Data:
- Number of email signups: 800
- Number of unique visitors who saw the signup form/banner: 40,000
- Calculation:
Email Signup Rate = (800 / 40,000) * 100 = 2%
This indicates that 2% of the visitors exposed to your email signup call-to-action are converting into subscribers.
Understanding how to calculate conversion rate for these different scenarios empowers D2C brands to pinpoint areas of strength and weakness within their sales funnel. By breaking down the overall conversion rate into smaller, actionable metrics, you can identify specific pages, campaigns, or user flows that require optimization, leading to more targeted and effective improvements across your entire e-commerce operation.
[INLINE IMAGE 1: place after second H2 | alt=”how to calculate conversion rate concept illustration”]
Beyond the Basics: Different Conversion Rate Metrics to Track
While the overall site conversion rate is a critical indicator of your e-commerce health, a truly comprehensive optimization strategy requires a deeper dive into more granular conversion metrics. By dissecting the customer journey into distinct stages and tracking specific conversion points, D2C brands can identify bottlenecks, understand user behavior, and implement highly targeted improvements. Knowing how to calculate conversion rate for these various stages provides invaluable insights.
Overall Site Conversion Rate
This is the big picture number, typically calculated as total completed purchases divided by total unique website visitors (or sessions) over a specified period. It offers a general health check of your entire e-commerce operation. While crucial, relying solely on this metric can mask underlying issues within specific parts of your funnel.
Product Page Conversion Rate
This metric measures how many visitors to a specific product page add that product to their cart.
Product Page CR = (Number of Product Adds-to-Cart / Number of Unique Product Page Views) * 100
A low product page conversion rate might indicate issues with product descriptions, images, pricing, reviews, or a lack of clear call-to-action on that particular page.
Add-to-Cart Rate
This metric tracks the percentage of visitors who add any item to their shopping cart.
Add-to-Cart Rate = (Number of Add-to-Cart Events / Number of Unique Visitors) * 100
A healthy add-to-cart rate suggests that visitors are finding products they are interested in. If this rate is high but your checkout completion rate is low, it points to issues later in the funnel.
Checkout Completion Rate (Purchase Funnel Conversion Rate)
This is arguably one of the most critical micro-conversion rates, measuring the percentage of users who start the checkout process and successfully complete a purchase. You can also break this down further into each step of your checkout (e.g., “shipping info submitted rate,” “payment info submitted rate”).
Checkout Completion Rate = (Number of Completed Purchases / Number of Initiated Checkouts) * 100
A low checkout completion rate is a red flag, indicating potential friction points such as complex forms, unexpected shipping costs, limited payment options, or security concerns during the final stages of the purchase.
Email List Sign-up Rate
For D2C brands, building an email list is paramount for retention and remarketing. This rate measures the effectiveness of your email capture strategies.
Email Sign-up Rate = (Number of New Email Subscribers / Number of Unique Visitors Exposed to Form) * 100
This can be tracked for specific pop-ups, banners, or dedicated landing pages. A robust email list fuels future marketing campaigns and builds direct customer relationships.
Mobile vs. Desktop Conversion Rates
In a mobile-first world, comparing conversion rates across devices is non-negotiable.
Mobile CR = (Mobile Purchases / Mobile Visitors) * 100
Desktop CR = (Desktop Purchases / Desktop Visitors) * 100
Often, mobile conversion rates lag behind desktop. A significant disparity highlights potential UX issues on your mobile site that need immediate attention, such as slow loading times, non-responsive design, or difficult navigation on smaller screens. Optimizing for mobile is a fundamental aspect of D2C growth in 2026 and beyond.
Segmented Conversion Rates
Beyond device type, segmenting your conversion rates by different dimensions offers even deeper insights:
- Traffic Source: How do visitors from organic search convert compared to those from paid ads, social media, or email marketing? This helps optimize your marketing channel allocation.
- New vs. Returning Customers: Do returning customers convert at a higher rate (as expected)? If not, your loyalty programs or retargeting might need work.
- Geographic Location: Are there regional differences in conversion? This might inform localized marketing efforts or shipping strategies.
- Product Category/Brand: How do different product categories perform? This can help identify best-sellers, underperformers, or categories that need more promotional support.
By regularly calculating and analyzing these diverse conversion metrics, D2C businesses can move beyond superficial understanding to pinpoint precise areas for optimization. This detailed approach allows for data-driven decisions that translate into tangible improvements in user experience, marketing effectiveness, and ultimately, greater profitability.
Benchmarking Your Performance: What is a Good Conversion Rate?
After you calculate conversion rate for your e-commerce store, the immediate next question is often, “Is this good?” The answer, like many things in business, is nuanced. What constitutes a “good” conversion rate is not a universal constant; it’s heavily influenced by various factors specific to your industry, product, traffic, and brand maturity.
Industry Averages and Their Context
General e-commerce conversion rates typically hover around 1% to 4%. However, these are broad averages that can be misleading without context. For D2C brands, niche industries, specific product types, and price points can all significantly impact what’s considered a benchmark.
- General E-commerce Average: Often cited figures range from 1.5% to 3.5%. This provides a very basic starting point.
- High-Value Products: Brands selling luxury goods, high-end electronics, or specialized B2B services might have lower conversion rates (e.g., 0.5% – 1.5%) due to longer consideration cycles and higher price points, but their average order value (AOV) is significantly higher.
- Low-Value/Impulse Buy Products: Stores selling low-cost consumer goods, fast fashion, or subscription boxes might see higher rates (e.g., 3% – 5%+) due to lower barriers to purchase and immediate gratification.
- D2C Niche: Specific D2C categories often have their own benchmarks. For example, beauty and cosmetics might differ from home goods or specialty foods. Researching industry-specific reports (e.g., Shopify reports, industry association data) can provide more relevant benchmarks for your particular niche.
It’s crucial to remember that these averages are just that—averages. They represent a blend of highly optimized stores and those performing poorly. Your goal should rarely be just to “meet the average,” but rather to exceed it and continuously improve.
Factors Influencing Benchmarks
Several critical factors profoundly influence what a realistic and “good” conversion rate looks like for your specific D2C brand:
- Product Type and Price Point:
- High-Consideration Purchases: Products requiring significant investment (e.g., furniture, electronics, custom goods) naturally have longer sales cycles and lower conversion rates. Customers need more information, comparisons, and trust signals.
- Low-Consideration Purchases: Impulse buys, consumables, or low-cost items typically convert at higher rates due to less risk and quicker decision-making.
- Traffic Source and Quality:
- Direct Traffic / Branded Search: Visitors who type your URL directly or search for your brand name are often highly qualified and convert at much higher rates.
- Paid Ads: Conversion rates from paid channels (Google Ads, Facebook Ads) vary based on targeting precision, ad copy, and landing page relevance. Highly targeted ads generally yield better conversion rates.
- Organic Search: Visitors from organic search can convert well if the keywords they used align perfectly with your product offerings.
- Social Media: While excellent for brand building and awareness, social media traffic often has lower conversion rates as users are typically in a browsing rather than buying mindset.
- Brand Maturity and Recognition:
- Established Brands: Well-known D2C brands with strong trust and loyalty often enjoy higher conversion rates due to brand equity.
- New Brands: Startups typically face lower initial conversion rates as they work to build trust, authority, and brand recognition.
- Seasonality and Promotions: Conversion rates can spike significantly during sales events (Black Friday, Cyber Monday), holidays, or when specific promotions are active.
- Website User Experience (UX): A fast, intuitive, mobile-responsive, and visually appealing website with clear navigation will always convert better than a slow, clunky, or confusing one.
The Importance of Internal Benchmarking
While external industry benchmarks offer a rough guide, the most valuable benchmark for your D2C brand is your own historical performance. Once you consistently calculate conversion rate, you can track its evolution over time.
- Establishing a Baseline: Understand your current average conversion rate.
- Tracking Trends: Monitor how your conversion rate changes month-to-month or quarter-to-quarter. Are you improving? Declining?
- Measuring Impact of Changes: When you implement a new feature, run an A/B test, or launch a new marketing campaign, compare the conversion rate before and after to assess its effectiveness.
- Setting Realistic Goals: Instead of aiming for an arbitrary industry average, focus on incremental improvements over your past performance. A consistent 0.1% increase month-over-month can lead to significant cumulative gains.
Ultimately, a “good” conversion rate is one that is continually improving, helps you achieve your business objectives, and ensures a healthy return on your marketing and operational investments. Don’t chase an elusive industry number; focus on understanding your own performance, identifying areas for improvement, and striving for continuous optimization.
[INLINE IMAGE 2: place after fourth H2 | alt=”how to calculate conversion rate comparison illustration”]
Tools and Analytics: Simplifying Conversion Rate Tracking
Manually tallying conversions and visitors to calculate conversion rate is simply not feasible for most e-commerce operations. Fortunately, a robust ecosystem of analytics and optimization tools exists to automate this process, provide deep insights, and empower D2C brands to make data-driven decisions. These tools are indispensable for understanding user behavior and systematically improving your conversion rates.
Google Analytics (GA4) Setup and Reports
Google Analytics 4 (GA4) is Google’s latest analytics platform, offering a powerful, event-based data model that is particularly well-suited for e-commerce. It allows you to track a wide array of user interactions as “events” and then define these events as “conversions.”
- Event-Based Tracking: Unlike its predecessor, GA4 tracks every user interaction (page views, clicks, scrolls, video plays, purchases) as an event.
- Conversion Configuration: You can easily mark specific events as conversions (e.g.,
purchase,add_to_cart,sign_up). This is where you configure what constitutes a “conversion” for your reporting. - Key Reports for Conversion Rate:
- Monetization -> E-commerce Purchases: Provides detailed revenue, purchase quantity, and product performance data.
- Engagement -> Events: Shows a list of all tracked events and allows you to see how often each event occurs.
- Engagement -> Conversions: Specifically lists the events you’ve marked as conversions, along with their count and conversion rate.
- Explorations (Funnels): This powerful feature allows you to visualize user journeys through specific steps (e.g., viewing a product, adding to cart, initiating checkout, purchasing) and identify drop-off points. This is crucial for understanding your conversion funnel.
- User Acquisition Reports: Helps you understand which traffic sources are driving the most conversions and at what rate.
- Setup Considerations: Proper implementation of GA4, including enhanced e-commerce tracking, is vital. This often involves integrating with your e-commerce platform or using Google Tag Manager.
Shopify Analytics
For D2C brands built on Shopify, the platform’s native analytics offers a convenient, integrated view of your store’s performance, including key conversion metrics.
- Dashboard Overview: Shopify’s dashboard provides an immediate snapshot of your sales, orders, and key conversion metrics like “Online store conversion rate.”
- Behavior Reports: You can see insights into visitor behavior, including referral sources, top landing pages, and search terms.
- Sales Reports: Detailed reports on sales by product, channel, and time period help contextualize your conversion data.
- Funnel Analysis: Shopify also offers a visual funnel report showing the journey from “sessions” to “add to cart,” “reached checkout,” and “sessions converted.” This quickly highlights where customers are dropping off.
- Ease of Use: For basic conversion rate tracking, Shopify Analytics is user-friendly and requires minimal setup. For more advanced analysis, it often pairs well with GA4.
Other D2C Platforms (e.g., BigCommerce, Magento, WooCommerce)
Most major e-commerce platforms offer their own built-in analytics dashboards, providing similar core functionalities to Shopify Analytics. They usually display:
- Overall conversion rates.
- Sales by traffic source.
- Product performance.
- Basic funnel visualization.
The depth and customization options vary by platform, but the fundamental capability to track and calculate conversion rate is standard. For advanced needs, integration with GA4 and specialized CRO tools is always recommended.
Dedicated CRO Tools (Hotjar, Optimizely, VWO)
While analytics platforms tell you *what* is happening, dedicated Conversion Rate Optimization (CRO) tools help you understand *why*. They provide qualitative and quantitative insights that go beyond simple numbers.
- Heatmaps (Hotjar, Crazy Egg): Visually show where users click, move their mouse, and scroll on your pages. This reveals areas of interest and areas of neglect.
- Session Recordings (Hotjar, FullStory): Record actual user sessions, allowing you to watch exactly how individual visitors navigate your site, where they struggle, and where they abandon.
- A/B Testing (Optimizely, VWO, Google Optimize – phasing out): Allows you to test different versions of a page or element (e.g., button color, headline, layout) against each other to see which performs better in terms of conversion rate. This is the cornerstone of data-driven optimization.
- Surveys and Feedback Polls (Hotjar, Qualaroo): Directly ask visitors about their experience, pain points, and why they didn’t convert. This qualitative data is invaluable for understanding user intent.
- Funnel Analysis (VWO, Optimizely): More advanced funnel visualizations that highlight drop-off rates at each stage and allow for segmentation.
Comparison Table: E-commerce Analytics & CRO Tools
Choosing the right combination of tools depends on your budget, technical expertise, and specific optimization goals. Here’s a comparison of some popular options:
| Tool Name | Primary Function | Key Features for Conversion Tracking | Best For | Pricing Model |
|---|---|---|---|---|
| Google Analytics 4 (GA4) | Web Analytics, Event Tracking | Event-based conversions, E-commerce reports, Funnel exploration, User acquisition insights. | Comprehensive data collection, understanding ‘what’ happened, integrated with Google ecosystem. | Free (with enterprise paid options) |
| Shopify Analytics | E-commerce Platform Analytics | Overall store CR, Sales reports, Basic funnel visualization, Referral sources. | Shopify stores needing quick, integrated performance overview. | Included with Shopify plans |
| Hotjar | Qualitative CRO & Feedback | Heatmaps, Session recordings, Surveys, Feedback polls, Funnel analysis. | Understanding ‘why’ users behave a certain way, identifying UX issues. | Freemium (basic plan free, paid tiers for more data) |
| Optimizely | A/B Testing & Experimentation | Robust A/B/n testing, Personalization, Feature experimentation. | Advanced experimentation, large enterprises, complex testing strategies. | Quote-based (Enterprise-level) |
| VWO (Visual Website Optimizer) | CRO Platform | A/B testing, Heatmaps, Session recordings, Funnel analysis, User surveys. | Mid-market to enterprise, all-in-one CRO platform. | Subscription-based (various tiers) |
| Crazy Egg | Heatmaps & User Behavior | Heatmaps, Scrollmaps, Confetti reports, Recordings, A/B testing (basic). | Visualizing user engagement, affordable entry into heatmapping. | Subscription-based (various tiers) |
By leveraging these tools effectively, D2C brands can move beyond simply knowing how to calculate conversion rate to actively understanding, diagnosing, and improving every aspect of their customer journey. The synergy between quantitative data (GA4, Shopify) and qualitative insights (Hotjar, VWO) forms the backbone of a successful conversion rate optimization strategy.
Explore advanced e-commerce analytics for deeper insights into your customer journey.
Strategies for Improvement: Boosting Your Conversion Rate
Knowing how to calculate conversion rate is only the first step; the real value lies in using that knowledge to drive tangible improvements. Conversion Rate Optimization (CRO) is an ongoing process of understanding your users, identifying friction points, testing hypotheses, and iterating based on data. For D2C brands, even small percentage gains can lead to significant revenue increases.
User Experience (UX) Optimization
A seamless and enjoyable user experience is paramount for converting visitors into customers.
- Intuitive Navigation: Ensure your website’s menu, search bar, and category filters are easy to find and use. A confused user is a lost user. Use clear labels and logical categorization.
- Mobile Responsiveness: With a majority of e-commerce traffic coming from mobile devices, your site must be perfectly optimized for all screen sizes. This includes touch-friendly elements, readable fonts, and fast loading times.
- Site Speed: Page load speed directly impacts conversion. Even a one-second delay can drastically reduce conversions. Optimize images, leverage caching, and minimize code to ensure your site is lightning-fast.
- Clear Call-to-Actions (CTAs): Your CTAs (e.g., “Add to Cart,” “Shop Now,” “Learn More”) should be prominent, compelling, and clearly indicate the next step. Use contrasting colors and action-oriented language.
Product Page Optimization
The product page is often where buying decisions are made. Optimizing it is crucial.
- High-Quality Images and Videos: Showcase your products with multiple high-resolution images from different angles, lifestyle shots, and close-ups. Product videos can significantly boost engagement and conversion by demonstrating usage or features.
- Compelling Descriptions: Go beyond basic features. Highlight benefits, solve pain points, and tell your brand’s story. Use persuasive language, clear formatting, and engaging storytelling.
- Social Proof: Display customer reviews, ratings, testimonials, and user-generated content prominently. Trust signals from peers are incredibly powerful.
- Stock Availability: Clearly indicate when items are in stock, low in stock, or out of stock. For out-of-stock items, offer options like email notifications for restock.
- Shipping & Returns Info: Provide transparent and easily accessible information about shipping costs, delivery times, and return policies directly on the product page or via clear links.
Checkout Process Optimization
The checkout funnel is the final hurdle to conversion. Minimizing friction here is key.
- Reduced Steps & Guest Checkout: Streamline your checkout process to as few steps as possible. Offer a guest checkout option to avoid forcing users to create an account, which can deter first-time buyers.
- Multiple Payment Options: Support various payment methods, including major credit cards, PayPal, Apple Pay, Google Pay, and buy-now-pay-later services (e.g., Affirm, Klarna) to cater to diverse customer preferences.
- Clear Progress Indicators: Visually show customers where they are in the checkout process (e.g., “1 of 3: Shipping,” “2 of 3: Payment”).
- Security Badges: Display trust badges (SSL certificates, payment gateway logos) to reassure customers about the security of their personal and financial information.
- Error Validation: Implement real-time form validation to help users correct errors instantly, preventing frustration and abandonment.
Trust and Credibility
Building trust is fundamental for D2C brands.
- Customer Reviews & Testimonials: Actively solicit and display authentic reviews. They are powerful social proof.
- Clear Contact Information: Make it easy for customers to reach you (phone, email, live chat). Transparency builds confidence.
- Money-Back Guarantees & Warranties: Reduce perceived risk by offering clear guarantees.
- Professional Design: A clean, modern, and professional website design signals credibility and attention to detail.
A/B Testing Best Practices
A/B testing (or split testing) is the scientific method of CRO.
- Test One Element at a Time: To accurately attribute changes in conversion rate, isolate variables (e.g., headline, button color, image).
- Formulate a Hypothesis: Before testing, state what you expect to happen and why (e.g., “Changing the button color to green will increase clicks by 10% because green often signifies ‘go’”).
- Ensure Statistical Significance: Don’t end a test prematurely. Run it long enough to gather sufficient data and achieve statistical confidence in your results.
- Continuously Iterate: CRO is an ongoing cycle. Learn from each test, implement winners, and identify new areas for experimentation.
Personalization & Segmentation
Tailoring the experience to individual users can dramatically boost conversions.
- Personalized Product Recommendations: Based on browsing history, purchase behavior, or popular items.
- Segmented Email Campaigns: Send targeted emails based on customer segments (e.g., cart abandoners, new subscribers, high-value customers).
- Dynamic Content: Show different content or offers to visitors based on their location, traffic source, or past interactions.
Effective Call-to-Actions (CTAs)
A well-crafted CTA is a conversion magnet.
- Action-Oriented Verbs: Use strong verbs like “Shop Now,” “Discover More,” “Get Your Free Sample,” “Add to Bag.”
- Sense of Urgency/Scarcity (Ethical Use): Phrases like “Limited Stock,” “Ends Soon,” “Only X Left” can encourage immediate action, but use them genuinely.
- Value
Mastering E-commerce Profitability: A Comprehensive Guide on How to Calculate Conversion Rate for D2C Success
Affiliate disclosure: This article may contain affiliate links. Recommendations are independent and editorially driven.
In the dynamic world of direct-to-consumer (D2C) e-commerce, success isn’t just about driving traffic; it’s about making that traffic count. Every click, every visit, every interaction holds the potential for a sale, an email signup, or a deeper engagement with your brand. The bridge between potential and realized value is often measured by a single, critical metric: the conversion rate. Understanding how to calculate conversion rate and, more importantly, how to improve it, is foundational to sustainable growth and robust profitability for any online store.
For D2C brands, where every marketing dollar and every operational decision directly impacts the bottom line, optimizing the conversion rate isn’t merely a best practice—it’s an imperative. It allows you to transform existing website visitors into customers more efficiently, squeezing more value out of your current traffic without necessarily increasing your ad spend. This guide will demystify conversion rates, provide you with the exact formulas and methodologies to calculate them accurately, and equip you with advanced strategies to drive significant improvements across your e-commerce operations. By the end, you’ll not only know how to calculate conversion rate, but you’ll also possess a strategic framework for turning data into unparalleled D2C growth.
Understanding the Fundamentals: What is Conversion Rate?
Before diving into the mechanics of how to calculate conversion rate, it’s essential to grasp what this metric truly represents within the e-commerce landscape. At its core, a conversion rate is the percentage of your website visitors who complete a desired action. This “desired action” isn’t always a purchase; it can vary widely depending on your business goals and the specific page or campaign you’re evaluating.
Defining Conversion and Rate in E-commerce
A “conversion” in e-commerce refers to any action a user takes on your website that aligns with your business objectives. While the ultimate goal for most e-commerce sites is a sale (a macro-conversion), there are numerous smaller, incremental actions that contribute to the customer journey (micro-conversions).
- Macro-conversions: These are the primary, most valuable actions. For an e-commerce store, this almost always means a completed purchase.
- Micro-conversions: These are smaller steps that indicate user engagement and often lead towards a macro-conversion. Examples include:
- Signing up for an email newsletter
- Adding a product to the cart
- Adding a product to a wishlist
- Viewing a product video
- Downloading a lookbook or guide
- Starting a live chat session
- Reaching a specific number of page views
The “rate” simply expresses how frequently these desired actions occur relative to the total number of opportunities (typically website visitors or sessions). It’s a powerful indicator of your website’s effectiveness in guiding users towards your business goals.
Why Conversion Rate Matters for E-commerce & D2C Brands
For D2C brands operating in a competitive digital marketplace, the conversion rate isn’t just another vanity metric. It’s a direct reflection of your business’s health and potential for growth. Here’s why it’s so critically important:
- Direct Impact on Revenue: A higher conversion rate means more sales from the same amount of traffic. This directly translates to increased revenue without needing to spend more on customer acquisition.
- Optimizing Marketing Spend: If you’re investing heavily in advertising to drive traffic, a low conversion rate means you’re effectively wasting a portion of that budget. Improving conversion ensures a better return on your marketing investment (ROI).
- Enhanced Profitability: By generating more sales from existing traffic, you reduce your effective customer acquisition cost (CAC). This directly boosts your profit margins, allowing for reinvestment into product development, marketing, or infrastructure.
- Scalability and Sustainable Growth: Brands with optimized conversion funnels can scale more efficiently. Each new visitor has a higher probability of becoming a customer, making growth more predictable and sustainable.
- Improved User Experience (UX): Efforts to improve conversion rates naturally lead to a better, more intuitive, and frictionless experience for your users. This fosters customer loyalty and positive brand perception.
- Competitive Advantage: In a crowded D2C space, even a marginal increase in conversion rate can provide a significant edge over competitors who are not as focused on optimization.
The Economic Imperative: More Sales, Lower Costs
Consider two D2C brands, both spending $10,000 per month on advertising to drive 50,000 visitors to their respective websites. Brand A has a conversion rate of 1%, while Brand B has optimized theirs to 2%.
- Brand A: 50,000 visitors * 1% conversion = 500 sales
- Brand B: 50,000 visitors * 2% conversion = 1,000 sales
Brand B generates double the sales with the exact same marketing spend. This isn’t just about more revenue; it significantly impacts their customer acquisition cost and overall profitability. If the average order value (AOV) is $100, Brand B generates an additional $50,000 in revenue without any additional marketing outlay for traffic. This stark difference underscores why mastering how to calculate conversion rate and then actively optimizing it is not just beneficial, but absolutely essential for thriving in e-commerce.
The Essential Formula: How to Calculate Conversion Rate
Now that we understand the ‘what’ and ‘why,’ let’s get to the ‘how.’ Calculating your conversion rate is straightforward, relying on a simple, yet powerful, mathematical formula. This formula can be applied universally across various conversion types, offering clarity on your performance.
The Basic Conversion Rate Equation
The fundamental formula for calculating conversion rate is:
Conversion Rate = (Number of Conversions / Number of Visitors) * 100- Number of Conversions: This refers to the total count of desired actions completed within a specific time frame. For an e-commerce store, this is most commonly the total number of orders placed. However, it can also be the number of newsletter sign-ups, add-to-cart events, or any other micro-conversion you are tracking.
- Number of Visitors: This represents the total number of unique individuals who visited your website (or a specific page/section) within that same time frame. It’s crucial to distinguish between “visitors” (often measured as “users” in analytics platforms) and “sessions.” A single user can have multiple sessions, and sometimes using “sessions” as the denominator might make more sense depending on what you’re trying to measure. For overall site conversion, “users” is generally preferred to avoid double-counting repeat visits from the same person for a single conversion goal.
- * 100: We multiply by 100 to express the result as a percentage, which is the standard format for conversion rates.
Step-by-Step Calculation Guide
Let’s break down the process with a practical example to make it crystal clear:
- Define Your Conversion Goal: What specific action are you tracking? For this example, let’s say we want to calculate the overall purchase conversion rate for an e-commerce store.
- Choose Your Time Period: Select a specific duration for your analysis (e.g., a day, a week, a month, a quarter). Consistency is key here. Let’s use the last month.
- Gather Your Data: Access your analytics platform (e.g., Google Analytics, Shopify Analytics) to find the relevant numbers for your chosen time period.
- Number of Conversions: Let’s say your store recorded 1,500 completed purchases last month.
- Number of Visitors: Let’s say your store had 75,000 unique users (visitors) last month.
- Apply the Formula: Plug these numbers into the conversion rate formula.
Conversion Rate = (1,500 purchases / 75,000 visitors) * 100Conversion Rate = 0.02 * 100Conversion Rate = 2%
In this example, your e-commerce store achieved a 2% conversion rate for purchases last month. This means that for every 100 unique visitors, 2 of them made a purchase.
Practical Examples for Different Scenarios
The beauty of this formula is its versatility. You can apply it to various scenarios to gain granular insights:
Example 1: Product Page Conversion Rate
You want to see how effective a specific product page is at converting visitors into adding the item to their cart.
- Goal: Add to Cart
- Time Period: Last week
- Data:
- Number of “Add to Cart” clicks on Product X: 250
- Number of unique visitors to Product X page: 5,000
- Calculation:
Product X Add-to-Cart Rate = (250 / 5,000) * 100 = 5%
This tells you that 5% of visitors to that particular product page are adding the item to their cart.
Example 2: Email Signup Conversion Rate
You want to measure the effectiveness of your pop-up or banner promoting newsletter sign-ups.
- Goal: Email Signup
- Time Period: Last month
- Data:
- Number of email signups: 800
- Number of unique visitors who saw the signup form/banner: 40,000
- Calculation:
Email Signup Rate = (800 / 40,000) * 100 = 2%
This indicates that 2% of the visitors exposed to your email signup call-to-action are converting into subscribers.
Understanding how to calculate conversion rate for these different scenarios empowers D2C brands to pinpoint areas of strength and weakness within their sales funnel. By breaking down the overall conversion rate into smaller, actionable metrics, you can identify specific pages, campaigns, or user flows that require optimization, leading to more targeted and effective improvements across your entire e-commerce operation.
[INLINE IMAGE 1: place after second H2 | alt=”how to calculate conversion rate concept illustration”]
Beyond the Basics: Different Conversion Rate Metrics to Track
While the overall site conversion rate is a critical indicator of your e-commerce health, a truly comprehensive optimization strategy requires a deeper dive into more granular conversion metrics. By dissecting the customer journey into distinct stages and tracking specific conversion points, D2C brands can identify bottlenecks, understand user behavior, and implement highly targeted improvements. Knowing how to calculate conversion rate for these various stages provides invaluable insights.
Overall Site Conversion Rate
This is the big picture number, typically calculated as total completed purchases divided by total unique website visitors (or sessions) over a specified period. It offers a general health check of your entire e-commerce operation. While crucial, relying solely on this metric can mask underlying issues within specific parts of your funnel.
Product Page Conversion Rate
This metric measures how many visitors to a specific product page add that product to their cart.
Product Page CR = (Number of Product Adds-to-Cart / Number of Unique Product Page Views) * 100A low product page conversion rate might indicate issues with product descriptions, images, pricing, reviews, or a lack of clear call-to-action on that particular page.
Add-to-Cart Rate
This metric tracks the percentage of visitors who add any item to their shopping cart.
Add-to-Cart Rate = (Number of Add-to-Cart Events / Number of Unique Visitors) * 100A healthy add-to-cart rate suggests that visitors are finding products they are interested in. If this rate is high but your checkout completion rate is low, it points to issues later in the funnel.
Checkout Completion Rate (Purchase Funnel Conversion Rate)
This is arguably one of the most critical micro-conversion rates, measuring the percentage of users who start the checkout process and successfully complete a purchase. You can also break this down further into each step of your checkout (e.g., “shipping info submitted rate,” “payment info submitted rate”).
Checkout Completion Rate = (Number of Completed Purchases / Number of Initiated Checkouts) * 100A low checkout completion rate is a red flag, indicating potential friction points such as complex forms, unexpected shipping costs, limited payment options, or security concerns during the final stages of the purchase.
Email List Sign-up Rate
For D2C brands, building an email list is paramount for retention and remarketing. This rate measures the effectiveness of your email capture strategies.
Email Sign-up Rate = (Number of New Email Subscribers / Number of Unique Visitors Exposed to Form) * 100This can be tracked for specific pop-ups, banners, or dedicated landing pages. A robust email list fuels future marketing campaigns and builds direct customer relationships.
Mobile vs. Desktop Conversion Rates
In a mobile-first world, comparing conversion rates across devices is non-negotiable.
Mobile CR = (Mobile Purchases / Mobile Visitors) * 100Desktop CR = (Desktop Purchases / Desktop Visitors) * 100Often, mobile conversion rates lag behind desktop. A significant disparity highlights potential UX issues on your mobile site that need immediate attention, such as slow loading times, non-responsive design, or difficult navigation on smaller screens. Optimizing for mobile is a fundamental aspect of D2C growth in 2026 and beyond.
Segmented Conversion Rates
Beyond device type, segmenting your conversion rates by different dimensions offers even deeper insights:
- Traffic Source: How do visitors from organic search convert compared to those from paid ads, social media, or email marketing? This helps optimize your marketing channel allocation.
- New vs. Returning Customers: Do returning customers convert at a higher rate (as expected)? If not, your loyalty programs or retargeting might need work.
- Geographic Location: Are there regional differences in conversion? This might inform localized marketing efforts or shipping strategies.
- Product Category/Brand: How do different product categories perform? This can help identify best-sellers, underperformers, or categories that need more promotional support.
By regularly calculating and analyzing these diverse conversion metrics, D2C businesses can move beyond superficial understanding to pinpoint precise areas for optimization. This detailed approach allows for data-driven decisions that translate into tangible improvements in user experience, marketing effectiveness, and ultimately, greater profitability.
Benchmarking Your Performance: What is a Good Conversion Rate?
After you calculate conversion rate for your e-commerce store, the immediate next question is often, “Is this good?” The answer, like many things in business, is nuanced. What constitutes a “good” conversion rate is not a universal constant; it’s heavily influenced by various factors specific to your industry, product, traffic, and brand maturity.
Industry Averages and Their Context
General e-commerce conversion rates typically hover around 1% to 4%. However, these are broad averages that can be misleading without context. For D2C brands, niche industries, specific product types, and price points can all significantly impact what’s considered a benchmark.
- General E-commerce Average: Often cited figures range from 1.5% to 3.5%. This provides a very basic starting point.
- High-Value Products: Brands selling luxury goods, high-end electronics, or specialized B2B services might have lower conversion rates (e.g., 0.5% – 1.5%) due to longer consideration cycles and higher price points, but their average order value (AOV) is significantly higher.
- Low-Value/Impulse Buy Products: Stores selling low-cost consumer goods, fast fashion, or subscription boxes might see higher rates (e.g., 3% – 5%+) due to lower barriers to purchase and immediate gratification.
- D2C Niche: Specific D2C categories often have their own benchmarks. For example, beauty and cosmetics might differ from home goods or specialty foods. Researching industry-specific reports (e.g., Shopify reports, industry association data) can provide more relevant benchmarks for your particular niche.
It’s crucial to remember that these averages are just that—averages. They represent a blend of highly optimized stores and those performing poorly. Your goal should rarely be just to “meet the average,” but rather to exceed it and continuously improve.
Factors Influencing Benchmarks
Several critical factors profoundly influence what a realistic and “good” conversion rate looks like for your specific D2C brand:
- Product Type and Price Point:
- High-Consideration Purchases: Products requiring significant investment (e.g., furniture, electronics, custom goods) naturally have longer sales cycles and lower conversion rates. Customers need more information, comparisons, and trust signals.
- Low-Consideration Purchases: Impulse buys, consumables, or low-cost items typically convert at higher rates due to less risk and quicker decision-making.
- Traffic Source and Quality:
- Direct Traffic / Branded Search: Visitors who type your URL directly or search for your brand name are often highly qualified and convert at much higher rates.
- Paid Ads: Conversion rates from paid channels (Google Ads, Facebook Ads) vary based on targeting precision, ad copy, and landing page relevance. Highly targeted ads generally yield better conversion rates.
- Organic Search: Visitors from organic search can convert well if the keywords they used align perfectly with your product offerings.
- Social Media: While excellent for brand building and awareness, social media traffic often has lower conversion rates as users are typically in a browsing rather than buying mindset.
- Brand Maturity and Recognition:
- Established Brands: Well-known D2C brands with strong trust and loyalty often enjoy higher conversion rates due to brand equity.
- New Brands: Startups typically face lower initial conversion rates as they work to build trust, authority, and brand recognition.
- Seasonality and Promotions: Conversion rates can spike significantly during sales events (Black Friday, Cyber Monday), holidays, or when specific promotions are active.
- Website User Experience (UX): A fast, intuitive, mobile-responsive, and visually appealing website with clear navigation will always convert better than a slow, clunky, or confusing one.
The Importance of Internal Benchmarking
While external industry benchmarks offer a rough guide, the most valuable benchmark for your D2C brand is your own historical performance. Once you consistently calculate conversion rate, you can track its evolution over time.
- Establishing a Baseline: Understand your current average conversion rate.
- Tracking Trends: Monitor how your conversion rate changes month-to-month or quarter-to-quarter. Are you improving? Declining?
- Measuring Impact of Changes: When you implement a new feature, run an A/B test, or launch a new marketing campaign, compare the conversion rate before and after to assess its effectiveness.
- Setting Realistic Goals: Instead of aiming for an arbitrary industry average, focus on incremental improvements over your past performance. A consistent 0.1% increase month-over-month can lead to significant cumulative gains.
Ultimately, a “good” conversion rate is one that is continually improving, helps you achieve your business objectives, and ensures a healthy return on your marketing and operational investments. Don’t chase an elusive industry number; focus on understanding your own performance, identifying areas for improvement, and striving for continuous optimization.
[INLINE IMAGE 2: place after fourth H2 | alt=”how to calculate conversion rate comparison illustration”]
Tools and Analytics: Simplifying Conversion Rate Tracking
Manually tallying conversions and visitors to calculate conversion rate is simply not feasible for most e-commerce operations. Fortunately, a robust ecosystem of analytics and optimization tools exists to automate this process, provide deep insights, and empower D2C brands to make data-driven decisions. These tools are indispensable for understanding user behavior and systematically improving your conversion rates.
Google Analytics (GA4) Setup and Reports
Google Analytics 4 (GA4) is Google’s latest analytics platform, offering a powerful, event-based data model that is particularly well-suited for e-commerce. It allows you to track a wide array of user interactions as “events” and then define these events as “conversions.”
- Event-Based Tracking: Unlike its predecessor, GA4 tracks every user interaction (page views, clicks, scrolls, video plays, purchases) as an event.
- Conversion Configuration: You can easily mark specific events as conversions (e.g.,
purchase,add_to_cart,sign_up). This is where you configure what constitutes a “conversion” for your reporting. - Key Reports for Conversion Rate:
- Monetization -> E-commerce Purchases: Provides detailed revenue, purchase quantity, and product performance data.
- Engagement -> Events: Shows a list of all tracked events and allows you to see how often each event occurs.
- Engagement -> Conversions: Specifically lists the events you’ve marked as conversions, along with their count and conversion rate.
- Explorations (Funnels): This powerful feature allows you to visualize user journeys through specific steps (e.g., viewing a product, adding to cart, initiating checkout, purchasing) and identify drop-off points. This is crucial for understanding your conversion funnel.
- User Acquisition Reports: Helps you understand which traffic sources are driving the most conversions and at what rate.
- Setup Considerations: Proper implementation of GA4, including enhanced e-commerce tracking, is vital. This often involves integrating with your e-commerce platform or using Google Tag Manager.
Shopify Analytics
For D2C brands built on Shopify, the platform’s native analytics offers a convenient, integrated view of your store’s performance, including key conversion metrics.
- Dashboard Overview: Shopify’s dashboard provides an immediate snapshot of your sales, orders, and key conversion metrics like “Online store conversion rate.”
- Behavior Reports: You can see insights into visitor behavior, including referral sources, top landing pages, and search terms.
- Sales Reports: Detailed reports on sales by product, channel, and time period help contextualize your conversion data.
- Funnel Analysis: Shopify also offers a visual funnel report showing the journey from “sessions” to “add to cart,” “reached checkout,” and “sessions converted.” This quickly highlights where customers are dropping off.
- Ease of Use: For basic conversion rate tracking, Shopify Analytics is user-friendly and requires minimal setup. For more advanced analysis, it often pairs well with GA4.
Other D2C Platforms (e.g., BigCommerce, Magento, WooCommerce)
Most major e-commerce platforms offer their own built-in analytics dashboards, providing similar core functionalities to Shopify Analytics. They usually display:
- Overall conversion rates.
- Sales by traffic source.
- Product performance.
- Basic funnel visualization.
The depth and customization options vary by platform, but the fundamental capability to track and calculate conversion rate is standard. For advanced needs, integration with GA4 and specialized CRO tools is always recommended.
Dedicated CRO Tools (Hotjar, Optimizely, VWO)
While analytics platforms tell you *what* is happening, dedicated Conversion Rate Optimization (CRO) tools help you understand *why*. They provide qualitative and quantitative insights that go beyond simple numbers.
- Heatmaps (Hotjar, Crazy Egg): Visually show where users click, move their mouse, and scroll on your pages. This reveals areas of interest and areas of neglect.
- Session Recordings (Hotjar, FullStory): Record actual user sessions, allowing you to watch exactly how individual visitors navigate your site, where they struggle, and where they abandon.
- A/B Testing (Optimizely, VWO, Google Optimize – phasing out): Allows you to test different versions of a page or element (e.g., button color, headline, layout) against each other to see which performs better in terms of conversion rate. This is the cornerstone of data-driven optimization.
- Surveys and Feedback Polls (Hotjar, Qualaroo): Directly ask visitors about their experience, pain points, and why they didn’t convert. This qualitative data is invaluable for understanding user intent.
- Funnel Analysis (VWO, Optimizely): More advanced funnel visualizations that highlight drop-off rates at each stage and allow for segmentation.
Comparison Table: E-commerce Analytics & CRO Tools
Choosing the right combination of tools depends on your budget, technical expertise, and specific optimization goals. Here’s a comparison of some popular options:
Tool Name Primary Function Key Features for Conversion Tracking Best For Pricing Model Google Analytics 4 (GA4) Web Analytics, Event Tracking Event-based conversions, E-commerce reports, Funnel exploration, User acquisition insights. Comprehensive data collection, understanding ‘what’ happened, integrated with Google ecosystem. Free (with enterprise paid options) Shopify Analytics E-commerce Platform Analytics Overall store CR, Sales reports, Basic funnel visualization, Referral sources. Shopify stores needing quick, integrated performance overview. Included with Shopify plans Hotjar Qualitative CRO & Feedback Heatmaps, Session recordings, Surveys, Feedback polls, Funnel analysis. Understanding ‘why’ users behave a certain way, identifying UX issues. Freemium (basic plan free, paid tiers for more data) Optimizely A/B Testing & Experimentation Robust A/B/n testing, Personalization, Feature experimentation. Advanced experimentation, large enterprises, complex testing strategies. Quote-based (Enterprise-level) VWO (Visual Website Optimizer) CRO Platform A/B testing, Heatmaps, Session recordings, Funnel analysis, User surveys. Mid-market to enterprise, all-in-one CRO platform. Subscription-based (various tiers) Crazy Egg Heatmaps & User Behavior Heatmaps, Scrollmaps, Confetti reports, Recordings, A/B testing (basic). Visualizing user engagement, affordable entry into heatmapping. Subscription-based (various tiers) By leveraging these tools effectively, D2C brands can move beyond simply knowing how to calculate conversion rate to actively understanding, diagnosing, and improving every aspect of their customer journey. The synergy between quantitative data (GA4, Shopify) and qualitative insights (Hotjar, VWO) forms the backbone of a successful conversion rate optimization strategy.
Explore advanced e-commerce analytics for deeper insights into your customer journey.
Strategies for Improvement: Boosting Your Conversion Rate
Knowing how to calculate conversion rate is only the first step; the real value lies in using that knowledge to drive tangible improvements. Conversion Rate Optimization (CRO) is an ongoing process of understanding your users, identifying friction points, testing hypotheses, and iterating based on data. For D2C brands, even small percentage gains can lead to significant revenue increases.
User Experience (UX) Optimization
A seamless and enjoyable user experience is paramount for converting visitors into customers.
- Intuitive Navigation: Ensure your website’s menu, search bar, and category filters are easy to find and use. A confused user is a lost user. Use clear labels and logical categorization.
- Mobile Responsiveness: With a majority of e-commerce traffic coming from mobile devices, your site must be perfectly optimized for all screen sizes. This includes touch-friendly elements, readable fonts, and fast loading times.
- Site Speed: Page load speed directly impacts conversion. Even a one-second delay can drastically reduce conversions. Optimize images, leverage caching, and minimize code to ensure your site is lightning-fast.
- Clear Call-to-Actions (CTAs): Your CTAs (e.g., “Add to Cart,” “Shop Now,” “Learn More”) should be prominent, compelling, and clearly indicate the next step. Use contrasting colors and action-oriented language.
Product Page Optimization
The product page is often where buying decisions are made. Optimizing it is crucial.
- High-Quality Images and Videos: Showcase your products with multiple high-resolution images from different angles, lifestyle shots, and close-ups. Product videos can significantly boost engagement and conversion by demonstrating usage or features.
- Compelling Descriptions: Go beyond basic features. Highlight benefits, solve pain points, and tell your brand’s story. Use persuasive language, clear formatting, and engaging storytelling.
- Social Proof: Display customer reviews, ratings, testimonials, and user-generated content prominently. Trust signals from peers are incredibly powerful.
- Stock Availability: Clearly indicate when items are in stock, low in stock, or out of stock. For out-of-stock items, offer options like email notifications for restock.
- Shipping & Returns Info: Provide transparent and easily accessible information about shipping costs, delivery times, and return policies directly on the product page or via clear links.
Checkout Process Optimization
The checkout funnel is the final hurdle to conversion. Minimizing friction here is key.
- Reduced Steps & Guest Checkout: Streamline your checkout process to as few steps as possible. Offer a guest checkout option to avoid forcing users to create an account, which can deter first-time buyers.
- Multiple Payment Options: Support various payment methods, including major credit cards, PayPal, Apple Pay, Google Pay, and buy-now-pay-later services (e.g., Affirm, Klarna) to cater to diverse customer preferences.
- Clear Progress Indicators: Visually show customers where they are in the checkout process (e.g., “1 of 3: Shipping,” “2 of 3: Payment”).
- Security Badges: Display trust badges (SSL certificates, payment gateway logos) to reassure customers about the security of their personal and financial information.
- Error Validation: Implement real-time form validation to help users correct errors instantly, preventing frustration and abandonment.
Trust and Credibility
Building trust is fundamental for D2C brands.
- Customer Reviews & Testimonials: Actively solicit and display authentic reviews. They are powerful social proof.
- Clear Contact Information: Make it easy for customers to reach you (phone, email, live chat). Transparency builds confidence.
- Money-Back Guarantees & Warranties: Reduce perceived risk by offering clear guarantees.
- Professional Design: A clean, modern, and professional website design signals credibility and attention to detail.
A/B Testing Best Practices
A/B testing (or split testing) is the scientific method of CRO.
- Test One Element at a Time: To accurately attribute changes in conversion rate, isolate variables (e.g., headline, button color, image).
- Formulate a Hypothesis: Before testing, state what you expect to happen and why (e.g., “Changing the button color to green will increase clicks by 10% because green often signifies ‘go’”).
- Ensure Statistical Significance: Don’t end a test prematurely. Run it long enough to gather sufficient data and achieve statistical confidence in your results.
- Continuously Iterate: CRO is an ongoing cycle. Learn from each test, implement winners, and identify new areas for experimentation.
Personalization & Segmentation
Tailoring the experience to individual users can dramatically boost conversions.
- Personalized Product Recommendations: Based on browsing history, purchase behavior, or popular items.
- Segmented Email Campaigns: Send targeted emails based on customer segments (e.g., cart abandoners, new subscribers, high-value customers).
- Dynamic Content: Show different content or offers to visitors based on their location, traffic source, or past interactions.
Effective Call-to-Actions (CTAs)
A well-crafted CTA is a conversion magnet.
- Action-Oriented Verbs: Use strong verbs like “Shop Now,” “Discover More,” “Get Your Free Sample,” “Add to Bag.”
- Sense of Urgency/Scarcity (Ethical Use): Phrases like “Limited Stock,” “Ends Soon,” “Only X Left” can encourage immediate action, but use them genuinely.
- Value