
Mastering E-commerce CRO Metrics: The Definitive Guide to Boosting Online Store Profitability
Affiliate disclosure: This article may contain affiliate links. Recommendations are independent and editorially driven.
In the dynamic world of e-commerce, merely attracting visitors to your online store is no longer enough to guarantee sustained success. With increasing competition and evolving consumer expectations, the true differentiator lies in how effectively you convert those visitors into paying customers, and ultimately, loyal advocates. This is where a deep understanding and strategic application of ecommerce CRO metrics become paramount.
Conversion Rate Optimization (CRO) is not just a buzzword; it’s a critical methodology for any D2C brand or Shopify store aiming to maximize its potential without necessarily increasing ad spend. It’s about getting more out of what you already have – more sales, higher average order values, and greater customer lifetime value – by systematically improving your website experience. But how do you measure these improvements? How do you know if your optimization efforts are truly moving the needle? The answer lies in rigorously tracking and analyzing the right CRO metrics.
This comprehensive guide from e-comprofits will walk you through the essential ecommerce CRO metrics, explain how to track them, and demonstrate how to leverage these insights to drive significant and sustainable growth for your online business. From foundational KPIs to advanced analytical techniques, prepare to transform your data into actionable strategies that directly impact your bottom line in 2026 and beyond.
The Foundation of E-commerce Success: Understanding CRO and Its Core Principles
Before diving into the specific metrics, it’s crucial to solidify our understanding of Conversion Rate Optimization (CRO) itself. At its heart, CRO is the systematic process of increasing the percentage of website visitors who complete a desired goal – a conversion. For e-commerce, this desired goal is most often a purchase, but it can also include adding an item to a cart, signing up for an email list, or downloading a resource.
What is CRO and Why is it Indispensable for E-commerce?
CRO involves understanding how users navigate through your site, what actions they take, and what prevents them from converting. It’s a data-driven approach that combines analytics, user feedback, and A/B testing to identify areas for improvement. The primary objective is to enhance the user experience (UX) to make the conversion path as smooth and intuitive as possible.
For e-commerce, CRO is not just about making more sales; it’s about making more profitable sales. By optimizing your existing traffic, you reduce your reliance on constantly acquiring new, potentially expensive, customers. This leads to a lower Customer Acquisition Cost (CAC) and a higher Return on Investment (ROI) for your marketing efforts. In a competitive D2C landscape, every percentage point increase in your conversion rate can translate into substantial revenue growth without needing a larger marketing budget.
CRO vs. Other Optimization Efforts: A Symbiotic Relationship
It’s important to distinguish CRO from other optimization strategies like Search Engine Optimization (SEO) or Search Engine Marketing (SEM), while also recognizing their symbiotic relationship. SEO focuses on increasing organic visibility and attracting traffic; SEM involves paid advertising to drive traffic. CRO, on the other hand, focuses on what happens after the traffic arrives on your site.
- SEO & SEM: Bring visitors to your door.
- CRO: Ensures those visitors come inside and make a purchase.
Without effective CRO, even the highest quality traffic generated by SEO or SEM can result in missed opportunities and wasted ad spend. Conversely, stellar CRO efforts won’t reach their full potential without a steady stream of relevant traffic. They work best in tandem, creating a holistic growth strategy for your online store.
The Continuous Loop of CRO: Test, Learn, Implement, Repeat
CRO is not a one-time project; it’s an ongoing process. The digital landscape, consumer behaviors, and market trends are constantly evolving. What works today might be less effective tomorrow. Therefore, successful CRO practitioners embrace a continuous optimization loop:
- Analyze: Gather data on user behavior through analytics, heatmaps, and session recordings.
- Hypothesize: Formulate theories about why users aren’t converting and propose solutions.
- Test: Implement changes (e.g., A/B tests, multivariate tests) to validate hypotheses.
- Learn: Analyze test results to understand what worked, what didn’t, and why.
- Implement: Roll out successful changes permanently.
- Repeat: The process starts again, building on previous learnings.
This iterative approach ensures that your store is always adapting and improving, steadily chipping away at barriers to conversion and unlocking new levels of profitability.
Essential E-commerce CRO Metrics: The North Star for Growth
To effectively engage in the CRO loop, you need reliable data. The right metrics serve as your compass, guiding your optimization efforts and allowing you to quantify their impact. While a multitude of data points exist, certain ecommerce CRO metrics stand out as essential for nearly every online store. These are your “North Star” metrics, providing a high-level overview of your store’s health and efficiency.
Conversion Rate (CR): The Ultimate Indicator of Efficiency
The Conversion Rate is arguably the most fundamental CRO metric. It tells you the percentage of visitors who complete a desired action, typically a purchase, out of the total number of visitors.
Calculation: (Number of Conversions / Total Number of Visitors) x 100%
For example, if 10,000 visitors come to your store in a month and 200 make a purchase, your conversion rate is 2%. Benchmarks vary widely by industry, product type, and traffic source, but a common range for e-commerce is 1-3%. A healthy conversion rate indicates that your website effectively guides visitors towards making a purchase, validating your product-market fit, user experience, and marketing messages.
Average Order Value (AOV): Maximizing Each Transaction
Average Order Value measures the average dollar amount spent each time a customer places an order on your website. This metric is crucial because increasing AOV means you’re earning more revenue per customer without needing to increase your visitor count or even your conversion rate.
Calculation: Total Revenue / Total Number of Orders
If your store generated $50,000 from 1,000 orders, your AOV is $50. Strategies to improve AOV include cross-selling, upselling, offering bundle deals, free shipping thresholds, and volume discounts. A higher AOV directly translates to increased profitability per customer, making it a powerful lever for growth.
Customer Lifetime Value (CLTV): The Long-Term Profitability Powerhouse
Customer Lifetime Value is a prediction of the total revenue a business can reasonably expect from a single customer account throughout the duration of their relationship. While AOV focuses on a single transaction, CLTV looks at the entire customer journey and their repeat purchases.
Calculation (Simplified): (Average Order Value x Purchase Frequency Rate) x Customer Lifespan
A higher CLTV indicates strong customer loyalty and retention, which is often far more cost-effective than constantly acquiring new customers. Focusing on CLTV encourages strategies like loyalty programs, personalized marketing, exceptional customer service, and post-purchase engagement. Optimizing for CLTV ensures long-term sustainable growth and a healthier overall business model.
Understanding these three core metrics provides a robust framework for evaluating your e-commerce performance. They represent the immediate impact of your site’s efficiency (CR), the value extracted from each transaction (AOV), and the long-term profitability of your customer relationships (CLTV). By consistently monitoring and striving to improve these, you lay a solid foundation for your CRO strategy.
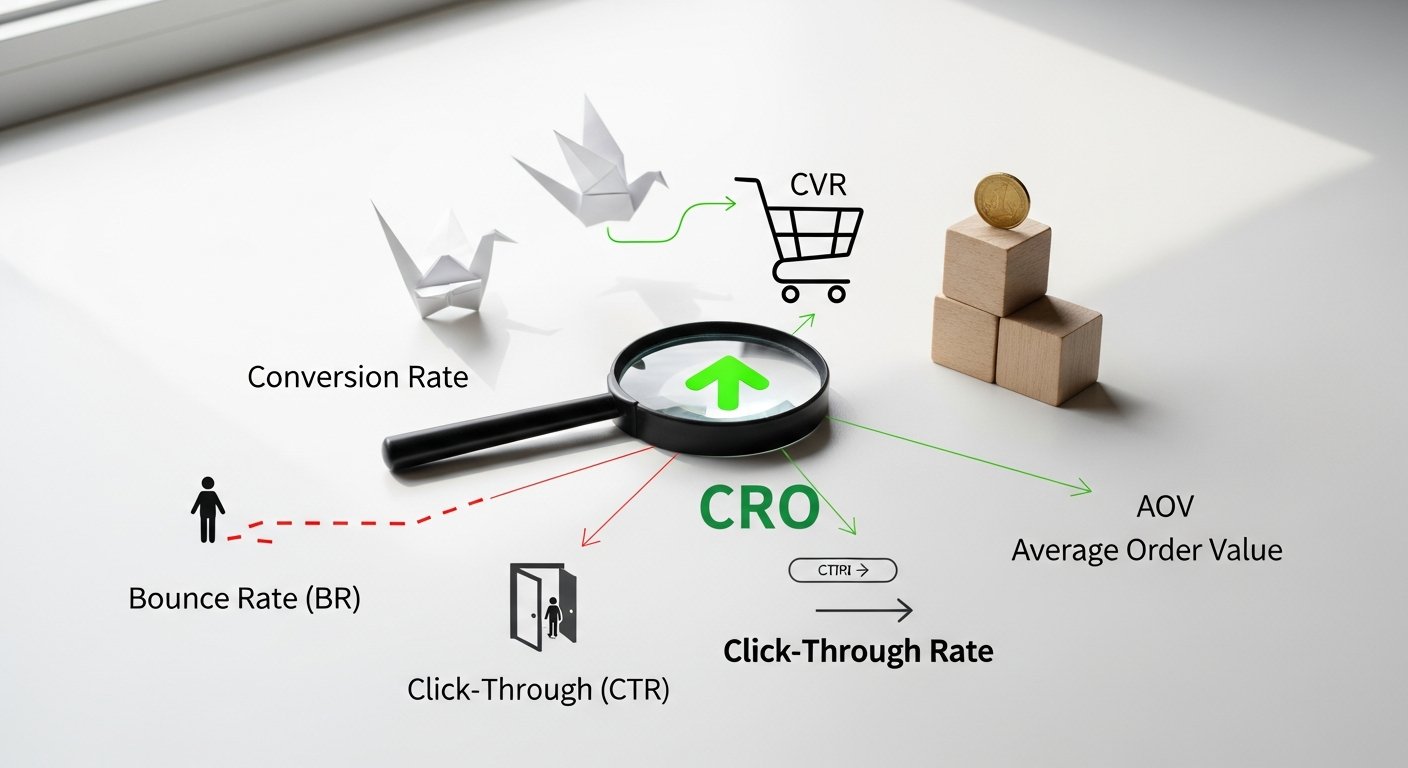
[INLINE IMAGE 1: place after second H2 | alt=”ecommerce cro metrics concept illustration”]
Diving Deeper: Granular Metrics for Conversion Funnel Optimization
While CR, AOV, and CLTV provide the macro view, successful CRO requires a granular understanding of user behavior at every stage of the customer journey. This means dissecting your conversion funnel and examining specific ecommerce CRO metrics that highlight opportunities and bottlenecks. Analyzing these micro-conversions allows you to pinpoint exactly where users are dropping off and what aspects of your site need attention.
Top-of-Funnel Engagement Metrics: Attracting and Hooking Visitors
These metrics gauge how effectively your site engages initial visitors and whether they find what they’re looking for.
- Bounce Rate: The percentage of visitors who land on a page and then leave without interacting further or navigating to other pages on your site. A high bounce rate often indicates poor targeting, irrelevant content, slow loading times, or a confusing layout. Optimizing this can significantly improve the quality of your engaged audience.
- Exit Rate: Similar to bounce rate, but specific to a particular page. It’s the percentage of visitors who leave your site from a specific page, regardless of how many other pages they visited before. High exit rates on crucial pages like product pages or checkout steps are red flags that need investigation.
- Time on Page/Site: The average duration a user spends on a specific page or across your entire site. Longer times generally suggest higher engagement and interest, especially on product pages or content pages. Exception: Very long times on a form or checkout page might indicate confusion.
- Pages Per Session: The average number of pages a user views during a single session. A higher number often signifies deeper exploration and engagement with your site’s content and offerings.
Mid-Funnel Interaction Metrics: Guiding Intent Towards Purchase
Once visitors are engaged, these metrics track their progression towards a purchasing decision.
- Add-to-Cart Rate: The percentage of product page visitors who add an item to their shopping cart. This is a critical indicator of purchase intent. Low rates here could point to issues with product descriptions, images, pricing, or calls to action.
- Initiate Checkout Rate: The percentage of sessions where a user adds an item to their cart and then proceeds to the first step of the checkout process. A significant drop-off between add-to-cart and initiating checkout suggests problems with the cart page itself – unexpected costs, complex navigation, or security concerns.
- Product Page Conversion Rate: The percentage of visitors to a specific product page who make a purchase of that product. This is a powerful metric for evaluating individual product performance and optimizing individual product pages for better results.
- Email Opt-in Rate: The percentage of visitors who subscribe to your email list. While not a direct purchase, email subscribers are highly valuable for nurturing leads and driving future sales through email marketing campaigns. Optimizing this can significantly impact CLTV.
Bottom-of-Funnel Transaction Metrics: Sealing the Deal
These metrics are focused on the final stages of the purchase process, where conversion is imminent or lost.
- Cart Abandonment Rate: The percentage of customers who add items to their shopping cart but then abandon the purchase before completing the transaction. This is one of the most significant revenue leaks for e-commerce stores, often ranging from 60-80%. Common reasons include unexpected shipping costs, complex checkout processes, or lack of preferred payment options.
- Purchase Conversion Rate (Overall): While similar to the main Conversion Rate, this often refers specifically to the percentage of visitors who complete a purchase among those who initiated checkout. This helps isolate issues within the checkout flow itself.
- Repeat Purchase Rate: The percentage of customers who make more than one purchase from your store within a specific timeframe. This metric is a direct reflection of customer loyalty and the effectiveness of your post-purchase engagement strategies, directly impacting CLTV. Improving this rate is usually more cost-effective than acquiring new customers.
By monitoring these granular metrics, you can diagnose specific issues within your conversion funnel, prioritize optimization efforts, and implement targeted changes that yield measurable improvements. Each metric tells a story about your customer’s journey, and by listening carefully, you can guide them to a successful conversion.
Attribution Models and Their Impact on CRO Metric Analysis

Understanding how customers arrive at your site and what influences their purchase decisions is crucial for effective CRO. This is where attribution models come into play. An attribution model is the rule, or set of rules, that determines how credit for sales and conversions is assigned to touchpoints in conversion paths. Without a clear attribution model, interpreting your ecommerce CRO metrics can be misleading, leading to misallocated marketing budgets and ineffective optimization strategies.
Why Attribution Matters for CRO Strategy
Imagine a customer who sees your ad on social media, clicks a search ad a week later, reads a blog post, and then makes a purchase after clicking on an email link. Which touchpoint gets credit for the sale? Different attribution models would give credit to different channels, drastically altering your perceived ROI for each. For CRO, this directly impacts where you focus your optimization efforts. If you solely credit the last touchpoint, you might ignore crucial earlier interactions that nurtured the lead and built trust.
Proper attribution helps you:
- Understand the true value of each marketing channel.
- Identify influential touchpoints in the customer journey.
- Optimize your spending across various campaigns.
- Inform your CRO efforts by revealing which pages and interactions are critical precursors to conversion.
Common Attribution Models and How They Inform CRO
Each model has its strengths and weaknesses, offering a different perspective on your conversion data:
- Last-Click Attribution:
- How it works: 100% of the credit for the conversion goes to the very last touchpoint the customer interacted with before converting.
- CRO Impact: Simplistic but can undervalue upper-funnel activities. Often used for direct response campaigns. If you only look at this, you might over-optimize your checkout page and ignore issues on product pages.
- First-Click Attribution:
- How it works: 100% of the credit goes to the very first touchpoint in the conversion path.
- CRO Impact: Highlights channels effective at initiating customer journeys. Useful for understanding brand awareness and initial engagement. Could lead you to focus CRO on landing pages and top-of-funnel content.
- Linear Attribution:
- How it works: Credit is equally distributed across all touchpoints in the conversion path.
- CRO Impact: Provides a balanced view, acknowledging every interaction’s role. Encourages optimization across the entire journey, from initial discovery to final purchase.
- Time Decay Attribution:
- How it works: Touchpoints closer in time to the conversion receive more credit. Credit decreases exponentially as you go further back in the path.
- CRO Impact: Useful for longer sales cycles, where more recent interactions are often more influential. Balances initial discovery with late-stage persuasion.
- Position-Based (U-Shaped) Attribution:
- How it works: Assigns 40% credit to the first and last interactions, and the remaining 20% is distributed evenly among the middle interactions.
- CRO Impact: Recognizes the importance of both discovery and final conversion points. Encourages optimizing both initial landing experiences and crucial last-touch elements like checkout.
- Data-Driven Attribution (DDA):
- How it works: Uses machine learning to algorithmically distribute credit based on actual contribution of each touchpoint. This model often relies on data from Google Analytics 4 (GA4) or other advanced platforms.
- CRO Impact: The most sophisticated approach, often providing the most accurate insights. It helps you understand which touchpoints truly move the needle, allowing for highly targeted CRO experiments and budget allocation.
Choosing the right attribution model (or models, as many businesses use multiple views) is fundamental to correctly interpreting your ecommerce CRO metrics. Without it, you might be optimizing the wrong areas or misjudging the impact of your changes, leading to suboptimal results. Regular review of your attribution model assumptions is a best practice, especially as your marketing mix or customer journey evolves.
[INLINE IMAGE 2: place after fourth H2 | alt=”ecommerce cro metrics comparison illustration”]
Tools and Technologies for Tracking and Analyzing E-commerce CRO Metrics
Effective tracking and analysis of ecommerce CRO metrics are impossible without the right tools. The market offers a vast array of solutions, each specializing in different aspects of data collection, visualization, and experimentation. Integrating these tools creates a powerful ecosystem for identifying optimization opportunities and measuring the success of your CRO efforts.
Analytics Platforms: The Core Data Hub
These platforms are the foundation for tracking virtually all your website’s traffic and conversion data.
- Google Analytics 4 (GA4): As the current standard, GA4 offers a robust, event-driven data model perfect for understanding the full customer journey across devices.
- Setting up Goals and Events: Crucial for tracking specific CRO metrics like “Add to Cart,” “Initiate Checkout,” and “Purchase.” Properly configured events allow for detailed funnel analysis and audience segmentation.
- Custom Reports: GA4’s flexible reporting allows you to create dashboards tailored to your key CRO metrics, providing quick insights into performance.
- Attribution Modeling: As discussed, GA4 offers sophisticated data-driven attribution, helping you understand the real impact of your marketing channels on conversions.
- Shopify Analytics (Built-in Features): For Shopify store owners, the platform’s native analytics dashboard provides immediate access to essential sales, customer, and conversion data. While less granular than GA4, it’s excellent for quick overviews of revenue, AOV, and basic conversion funnels. It integrates seamlessly with Shopify’s ecosystem.
- Other Platforms (e.g., Adobe Analytics): For larger enterprises, platforms like Adobe Analytics offer even more advanced customization, integration capabilities, and robust reporting, often part of a broader marketing cloud solution.
Heatmaps and Session Recordings: Visualizing User Behavior
Quantitative data from analytics tells you what is happening, but heatmaps and session recordings show you why. They provide invaluable qualitative insights into user experience.
- Hotjar: A popular all-in-one tool offering heatmaps (click, scroll, move), session recordings, surveys, and feedback polls. It helps visualize where users click, how far they scroll, and where they encounter friction.
- Crazy Egg: Another strong contender for heatmaps and scroll maps. It’s excellent for understanding user attention and engagement on specific page elements.
- FullStory: Provides high-fidelity session recordings, allowing you to replay user sessions exactly as they happened. It also offers powerful search and segmentation to find specific user journeys that highlight pain points or successful paths.
These tools are indispensable for uncovering UX issues that might not be apparent from numerical data alone, such as confusing layouts, broken elements, or overlooked calls to action.
A/B Testing Tools: Experimentation for Optimization
A/B testing is the cornerstone of data-driven CRO. These tools allow you to create different versions of a web page or element and show them to different segments of your audience to determine which performs better.
- VWO (Visual Website Optimizer): A comprehensive CRO platform offering A/B testing, multivariate testing, server-side testing, and personalization. It includes a visual editor for easy experiment setup.
- Optimizely: A leading enterprise-grade experimentation platform, strong for complex tests, personalization, and advanced feature rollouts.
- Convert.com: An affordable and powerful A/B testing tool, often praised for its excellent customer support and robust features, suitable for businesses of all sizes.
While Google Optimize, a widely used free tool, has been deprecated, the market still offers many excellent alternatives. The key is to select a tool that matches your technical capabilities and testing volume, allowing you to run statistically significant experiments and confidently implement winning variations.
CRM and Marketing Automation: Integrating for CLTV and Segmentation
These tools, while not directly for CRO experimentation, are crucial for leveraging your CRO insights for long-term customer value.
- Klaviyo: A leading marketing automation platform for e-commerce, integrating with Shopify and other platforms. It uses customer data to segment audiences, personalize emails, and automate flows (e.g., abandoned cart reminders, win-back campaigns), directly impacting repeat purchase rates and CLTV.
- Mailchimp, HubSpot: Broader marketing automation and CRM platforms that can manage email lists, segment customers, and track customer interactions over time, feeding into CLTV calculations and personalized CRO efforts.
By effectively using a combination of these tools, e-commerce businesses can gather, analyze, and act on their CRO metrics with precision, leading to continuous improvements in conversion rates and overall profitability.
| Tool Category | Example Tools | Primary Use Case for CRO | Key Benefit |
|---|---|---|---|
| Web Analytics | Google Analytics 4, Shopify Analytics, Adobe Analytics | Quantitative data tracking (traffic, conversions, funnels, revenue) | Comprehensive view of site performance and user flows |
| Heatmaps & Session Recordings | Hotjar, Crazy Egg, FullStory | Qualitative user behavior analysis (clicks, scrolls, navigation) | Visual understanding of user interaction and pain points |
| A/B Testing Platforms | VWO, Optimizely, Convert.com | Controlled experimentation to validate hypotheses | Data-driven decision making and measurable impact on conversion rates |
| Feedback & Survey Tools | Hotjar Surveys, Qualaroo, UserTesting | Direct user feedback and understanding motivations/barriers | Insights into user intent, objections, and desires |
| CRM & Marketing Automation | Klaviyo, Mailchimp, HubSpot | Personalization, segmentation, and post-purchase engagement | Boosting repeat purchases and Customer Lifetime Value (CLTV) |
Strategizing with CRO Metrics: From Data to Actionable Insights
Collecting data on ecommerce CRO metrics is only the first step. The real value comes from transforming that data into actionable insights that drive strategic improvements. This requires a systematic approach to analysis, hypothesis generation, and experimentation.
Identifying Bottlenecks in the Customer Journey
Your conversion funnel is a journey, and every step presents a potential point of friction. By meticulously mapping out the customer journey – from landing on your homepage to completing a purchase – and overlaying your granular CRO metrics, you can identify precisely where users are dropping off. High exit rates on product pages, a sharp decline in “add to cart” after viewing specific categories, or a significant cart abandonment rate are all indicators of bottlenecks. Use tools like GA4’s Funnel Exploration report to visualize these drops. A common area of friction is often the checkout process, especially with unexpected shipping costs or complicated forms. Understanding these points allows you to target your optimization efforts most effectively.
For deeper insights into user experience and potential bottlenecks, consider exploring e-commerce UX best practices to complement your metric analysis.
Prioritizing Optimization Efforts: Impact vs. Effort
Once you’ve identified multiple potential areas for improvement, you can’t optimize everything at once. Prioritization is key. A useful framework is the “Impact vs. Effort” matrix:
- High Impact, Low Effort: These are your “quick wins.” Small changes that can yield significant results (e.g., optimizing button copy, improving page load speed on a critical page). Prioritize these first.
- High Impact, High Effort: These are strategic projects that require substantial resources but promise substantial returns (e.g., a complete checkout flow redesign, implementing advanced personalization). Plan these carefully.
- Low Impact, Low Effort: Minor tweaks with minimal expected return. Do these if time allows, but don’t prioritize over high-impact tasks.
- Low Impact, High Effort: Avoid these. They consume resources without promising much in return.
This systematic approach ensures your team’s energy is directed towards changes that will have the most meaningful impact on your ecommerce CRO metrics.
Segmenting Your Audience for Targeted CRO
Not all visitors are created equal, and a one-size-fits-all approach to CRO often falls short. Segmenting your audience allows you to tailor your optimization efforts to specific groups, leading to more effective results. Common segmentation approaches include:
- New vs. Returning Customers: New visitors might need more reassurance and clear navigation, while returning customers might respond better to loyalty incentives or personalized recommendations.
- Device Segmentation: Mobile users often have different browsing habits and expectations than desktop users. Optimizing for mobile conversion rates is crucial, as a significant portion of e-commerce traffic originates from smartphones.
- Geographic Segmentation: Different regions may have varying preferences for payment methods, shipping options, or even product types.
- Traffic Source: Visitors from paid ads might have higher intent than those from social media, requiring different landing page experiences.
By analyzing CRO metrics within these segments, you can uncover unique pain points and implement targeted optimizations that resonate more deeply with each group.
A/B Testing Hypotheses Based on Metric Deviations
Once you’ve identified a bottleneck and prioritized an optimization, the next step is to formulate a hypothesis and test it. A good hypothesis follows a structure like: “If I [make this change] for [this segment], then [this metric] will [increase/decrease] because [of this reason].”
For example: “If I simplify the checkout form to a single page for mobile users, then the cart abandonment rate will decrease because fewer steps reduce perceived effort.”
Use your A/B testing tools to implement and run these tests. It’s critical to ensure statistical significance before drawing conclusions. Small sample sizes or short test durations can lead to misleading results. Once a winning variation is identified, implement it permanently and continue the optimization loop. This rigorous, data-backed approach ensures that every change you make is a step towards higher conversion rates and increased profitability.
Advanced CRO Metrics and Predictive Analytics for Future Growth
As your e-commerce store matures and your understanding of foundational CRO metrics deepens, you can begin to explore more advanced metrics and predictive analytics. These go beyond immediate conversions to focus on long-term profitability, customer retention, and proactive optimization strategies.
Customer Acquisition Cost (CAC) vs. CLTV Ratio: The True Profitability Gauge
While CLTV is a vital metric on its own, its relationship with Customer Acquisition Cost (CAC) provides the clearest picture of your customer-level profitability.
CAC: The total cost of sales and marketing needed to acquire one new customer.
CLTV:CAC Ratio: Customer Lifetime Value / Customer Acquisition Cost
A ratio of 3:1 (meaning CLTV is three times CAC) is often considered healthy. A ratio below 1:1 indicates you’re losing money on each customer. A very high ratio (e.g., 5:1 or more) might suggest you could invest more in acquisition. By optimizing CRO metrics that boost CLTV (like repeat purchase rate, AOV) and simultaneously working to reduce CAC, you ensure sustainable, profitable growth.
Churn Rate: Identifying and Preventing Customer Loss
Churn rate measures the percentage of customers who stop purchasing from your store over a given period. For subscription-based e-commerce or businesses relying on repeat purchases, this is a critical metric.
Calculation: (Number of Lost Customers / Total Customers at Start of Period) x 100%
High churn suggests issues with product satisfaction, customer service, or competitive offerings. CRO efforts aimed at improving post-purchase experience, personalized communication, and loyalty programs can significantly reduce churn, directly impacting CLTV. Understanding customer retention strategies is crucial for managing churn effectively.
Return Rate/Refund Rate: Impact on Net Revenue and Customer Trust
This metric calculates the percentage of sold products that are returned or refunded. While often viewed as an operational concern, it has significant CRO implications.
Calculation: (Number of Returned Items / Total Items Sold) x 100%
High return rates can erode net revenue and impact customer trust. CRO efforts in this area involve optimizing product descriptions, improving product photography and videos, providing accurate sizing guides, and clear expectation setting to minimize discrepancies between product perception and reality. A low return rate can be a powerful trust signal that enhances future conversion rates.
Predictive CRO and AI in E-commerce: Anticipating Future Behavior
Moving beyond historical data, predictive analytics leverages machine learning and AI to forecast future customer behavior. This allows for proactive CRO strategies.
- Personalization Engines: AI-powered recommendations (products, content) based on browsing history and similar customer profiles can significantly increase conversion rates and AOV.
- Dynamic Pricing: Adjusting product prices in real-time based on demand, inventory levels, competitor pricing, and user segments can optimize revenue and conversion.
- Churn Prediction: Identifying customers at risk of churning before they leave, allowing for targeted retention campaigns.
- Cart Abandonment Prevention: AI can analyze user behavior in real-time to predict abandonment and trigger proactive interventions like personalized pop-ups or chat offers.
Implementing these advanced techniques allows e-commerce businesses to move from reactive optimization to proactive engagement, creating a truly optimized and future-ready online store. For D2C brands, this level of personalization and foresight can be a major competitive advantage.
Common Challenges and Best Practices in E-commerce CRO Metric Analysis
While the potential rewards of a robust CRO strategy are immense, the path is not without its challenges. Navigating these obstacles effectively is key to ensuring your CRO efforts yield consistent, meaningful results.
Data Overload and Irrelevance: Focusing on True KPIs
One of the biggest pitfalls in CRO is “analysis paralysis” – being overwhelmed by the sheer volume of data available. It’s easy to get lost in vanity metrics (e.g., page views, number of social media followers) that don’t directly correlate with business objectives.
Best Practice: Define your Key Performance Indicators (KPIs) upfront. Focus on metrics directly tied to your overarching goals (e.g., Conversion Rate, AOV, CLTV, Cart Abandonment Rate). Use dashboards to visualize these critical metrics clearly, filtering out the noise. Regular reviews should focus on these core KPIs, drilling down into supporting metrics only when anomalies appear. Remember, data is only
Mastering E-commerce CRO Metrics: The Definitive Guide to Boosting Online Store Profitability
Affiliate disclosure: This article may contain affiliate links. Recommendations are independent and editorially driven.
In the dynamic world of e-commerce, merely attracting visitors to your online store is no longer enough to guarantee sustained success. With increasing competition and evolving consumer expectations, the true differentiator lies in how effectively you convert those visitors into paying customers, and ultimately, loyal advocates. This is where a deep understanding and strategic application of ecommerce CRO metrics become paramount.
Conversion Rate Optimization (CRO) is not just a buzzword; it’s a critical methodology for any D2C brand or Shopify store aiming to maximize its potential without necessarily increasing ad spend. It’s about getting more out of what you already have – more sales, higher average order values, and greater customer lifetime value – by systematically improving your website experience. But how do you measure these improvements? How do you know if your optimization efforts are truly moving the needle? The answer lies in rigorously tracking and analyzing the right CRO metrics.
This comprehensive guide from e-comprofits will walk you through the essential ecommerce CRO metrics, explain how to track them, and demonstrate how to leverage these insights to drive significant and sustainable growth for your online business. From foundational KPIs to advanced analytical techniques, prepare to transform your data into actionable strategies that directly impact your bottom line in 2026 and beyond.
The Foundation of E-commerce Success: Understanding CRO and Its Core Principles
Before diving into the specific metrics, it’s crucial to solidify our understanding of Conversion Rate Optimization (CRO) itself. At its heart, CRO is the systematic process of increasing the percentage of website visitors who complete a desired goal – a conversion. For e-commerce, this desired goal is most often a purchase, but it can also include adding an item to a cart, signing up for an email list, or downloading a resource.
What is CRO and Why is it Indispensable for E-commerce?
CRO involves understanding how users navigate through your site, what actions they take, and what prevents them from converting. It’s a data-driven approach that combines analytics, user feedback, and A/B testing to identify areas for improvement. The primary objective is to enhance the user experience (UX) to make the conversion path as smooth and intuitive as possible.
For e-commerce, CRO is not just about making more sales; it’s about making more profitable sales. By optimizing your existing traffic, you reduce your reliance on constantly acquiring new, potentially expensive, customers. This leads to a lower Customer Acquisition Cost (CAC) and a higher Return on Investment (ROI) for your marketing efforts. In a competitive D2C landscape, every percentage point increase in your conversion rate can translate into substantial revenue growth without needing a larger marketing budget.
CRO vs. Other Optimization Efforts: A Symbiotic Relationship
It’s important to distinguish CRO from other optimization strategies like Search Engine Optimization (SEO) or Search Engine Marketing (SEM), while also recognizing their symbiotic relationship. SEO focuses on increasing organic visibility and attracting traffic; SEM involves paid advertising to drive traffic. CRO, on the other hand, focuses on what happens after the traffic arrives on your site.
- SEO & SEM: Bring visitors to your door.
- CRO: Ensures those visitors come inside and make a purchase.
Without effective CRO, even the highest quality traffic generated by SEO or SEM can result in missed opportunities and wasted ad spend. Conversely, stellar CRO efforts won’t reach their full potential without a steady stream of relevant traffic. They work best in tandem, creating a holistic growth strategy for your online store.
The Continuous Loop of CRO: Test, Learn, Implement, Repeat
CRO is not a one-time project; it’s an ongoing process. The digital landscape, consumer behaviors, and market trends are constantly evolving. What works today might be less effective tomorrow. Therefore, successful CRO practitioners embrace a continuous optimization loop:
- Analyze: Gather data on user behavior through analytics, heatmaps, and session recordings.
- Hypothesize: Formulate theories about why users aren’t converting and propose solutions.
- Test: Implement changes (e.g., A/B tests, multivariate tests) to validate hypotheses.
- Learn: Analyze test results to understand what worked, what didn’t, and why.
- Implement: Roll out successful changes permanently.
- Repeat: The process starts again, building on previous learnings.
This iterative approach ensures that your store is always adapting and improving, steadily chipping away at barriers to conversion and unlocking new levels of profitability.
Essential E-commerce CRO Metrics: The North Star for Growth
To effectively engage in the CRO loop, you need reliable data. The right metrics serve as your compass, guiding your optimization efforts and allowing you to quantify their impact. While a multitude of data points exist, certain ecommerce CRO metrics stand out as essential for nearly every online store. These are your “North Star” metrics, providing a high-level overview of your store’s health and efficiency.
Conversion Rate (CR): The Ultimate Indicator of Efficiency
The Conversion Rate is arguably the most fundamental CRO metric. It tells you the percentage of visitors who complete a desired action, typically a purchase, out of the total number of visitors.
Calculation: (Number of Conversions / Total Number of Visitors) x 100%
For example, if 10,000 visitors come to your store in a month and 200 make a purchase, your conversion rate is 2%. Benchmarks vary widely by industry, product type, and traffic source, but a common range for e-commerce is 1-3%. A healthy conversion rate indicates that your website effectively guides visitors towards making a purchase, validating your product-market fit, user experience, and marketing messages.
Average Order Value (AOV): Maximizing Each Transaction
Average Order Value measures the average dollar amount spent each time a customer places an order on your website. This metric is crucial because increasing AOV means you’re earning more revenue per customer without needing to increase your visitor count or even your conversion rate.
Calculation: Total Revenue / Total Number of Orders
If your store generated $50,000 from 1,000 orders, your AOV is $50. Strategies to improve AOV include cross-selling, upselling, offering bundle deals, free shipping thresholds, and volume discounts. A higher AOV directly translates to increased profitability per customer, making it a powerful lever for growth.
Customer Lifetime Value (CLTV): The Long-Term Profitability Powerhouse
Customer Lifetime Value is a prediction of the total revenue a business can reasonably expect from a single customer account throughout the duration of their relationship. While AOV focuses on a single transaction, CLTV looks at the entire customer journey and their repeat purchases.
Calculation (Simplified): (Average Order Value x Purchase Frequency Rate) x Customer Lifespan
A higher CLTV indicates strong customer loyalty and retention, which is often far more cost-effective than constantly acquiring new customers. Focusing on CLTV encourages strategies like loyalty programs, personalized marketing, exceptional customer service, and post-purchase engagement. Optimizing for CLTV ensures long-term sustainable growth and a healthier overall business model.
Understanding these three core metrics provides a robust framework for evaluating your e-commerce performance. They represent the immediate impact of your site’s efficiency (CR), the value extracted from each transaction (AOV), and the long-term profitability of your customer relationships (CLTV). By consistently monitoring and striving to improve these, you lay a solid foundation for your CRO strategy.
[INLINE IMAGE 1: place after second H2 | alt=”ecommerce cro metrics concept illustration”]
Diving Deeper: Granular Metrics for Conversion Funnel Optimization
While CR, AOV, and CLTV provide the macro view, successful CRO requires a granular understanding of user behavior at every stage of the customer journey. This means dissecting your conversion funnel and examining specific ecommerce CRO metrics that highlight opportunities and bottlenecks. Analyzing these micro-conversions allows you to pinpoint exactly where users are dropping off and what aspects of your site need attention.
Top-of-Funnel Engagement Metrics: Attracting and Hooking Visitors
These metrics gauge how effectively your site engages initial visitors and whether they find what they’re looking for.
- Bounce Rate: The percentage of visitors who land on a page and then leave without interacting further or navigating to other pages on your site. A high bounce rate often indicates poor targeting, irrelevant content, slow loading times, or a confusing layout. Optimizing this can significantly improve the quality of your engaged audience.
- Exit Rate: Similar to bounce rate, but specific to a particular page. It’s the percentage of visitors who leave your site from a specific page, regardless of how many other pages they visited before. High exit rates on crucial pages like product pages or checkout steps are red flags that need investigation.
- Time on Page/Site: The average duration a user spends on a specific page or across your entire site. Longer times generally suggest higher engagement and interest, especially on product pages or content pages. Exception: Very long times on a form or checkout page might indicate confusion.
- Pages Per Session: The average number of pages a user views during a single session. A higher number often signifies deeper exploration and engagement with your site’s content and offerings.
Mid-Funnel Interaction Metrics: Guiding Intent Towards Purchase
Once visitors are engaged, these metrics track their progression towards a purchasing decision.
- Add-to-Cart Rate: The percentage of product page visitors who add an item to their shopping cart. This is a critical indicator of purchase intent. Low rates here could point to issues with product descriptions, images, pricing, or calls to action.
- Initiate Checkout Rate: The percentage of sessions where a user adds an item to their cart and then proceeds to the first step of the checkout process. A significant drop-off between add-to-cart and initiating checkout suggests problems with the cart page itself – unexpected costs, complex navigation, or security concerns.
- Product Page Conversion Rate: The percentage of visitors to a specific product page who make a purchase of that product. This is a powerful metric for evaluating individual product performance and optimizing individual product pages for better results.
- Email Opt-in Rate: The percentage of visitors who subscribe to your email list. While not a direct purchase, email subscribers are highly valuable for nurturing leads and driving future sales through email marketing campaigns. Optimizing this can significantly impact CLTV.
Bottom-of-Funnel Transaction Metrics: Sealing the Deal
These metrics are focused on the final stages of the purchase process, where conversion is imminent or lost.
- Cart Abandonment Rate: The percentage of customers who add items to their shopping cart but then abandon the purchase before completing the transaction. This is one of the most significant revenue leaks for e-commerce stores, often ranging from 60-80%. Common reasons include unexpected shipping costs, complex checkout processes, or lack of preferred payment options.
- Purchase Conversion Rate (Overall): While similar to the main Conversion Rate, this often refers specifically to the percentage of visitors who complete a purchase among those who initiated checkout. This helps isolate issues within the checkout flow itself.
- Repeat Purchase Rate: The percentage of customers who make more than one purchase from your store within a specific timeframe. This metric is a direct reflection of customer loyalty and the effectiveness of your post-purchase engagement strategies, directly impacting CLTV. Improving this rate is usually more cost-effective than acquiring new customers.
By monitoring these granular metrics, you can diagnose specific issues within your conversion funnel, prioritize optimization efforts, and implement targeted changes that yield measurable improvements. Each metric tells a story about your customer’s journey, and by listening carefully, you can guide them to a successful conversion.
Attribution Models and Their Impact on CRO Metric Analysis
Understanding how customers arrive at your site and what influences their purchase decisions is crucial for effective CRO. This is where attribution models come into play. An attribution model is the rule, or set of rules, that determines how credit for sales and conversions is assigned to touchpoints in conversion paths. Without a clear attribution model, interpreting your ecommerce CRO metrics can be misleading, leading to misallocated marketing budgets and ineffective optimization strategies.
Why Attribution Matters for CRO Strategy
Imagine a customer who sees your ad on social media, clicks a search ad a week later, reads a blog post, and then makes a purchase after clicking on an email link. Which touchpoint gets credit for the sale? Different attribution models would give credit to different channels, drastically altering your perceived ROI for each. For CRO, this directly impacts where you focus your optimization efforts. If you solely credit the last touchpoint, you might ignore crucial earlier interactions that nurtured the lead and built trust.
Proper attribution helps you:
- Understand the true value of each marketing channel.
- Identify influential touchpoints in the customer journey.
- Optimize your spending across various campaigns.
- Inform your CRO efforts by revealing which pages and interactions are critical precursors to conversion.
Common Attribution Models and How They Inform CRO
Each model has its strengths and weaknesses, offering a different perspective on your conversion data:
- Last-Click Attribution:
- How it works: 100% of the credit for the conversion goes to the very last touchpoint the customer interacted with before converting.
- CRO Impact: Simplistic but can undervalue upper-funnel activities. Often used for direct response campaigns. If you only look at this, you might over-optimize your checkout page and ignore issues on product pages.
- First-Click Attribution:
- How it works: 100% of the credit goes to the very first touchpoint in the conversion path.
- CRO Impact: Highlights channels effective at initiating customer journeys. Useful for understanding brand awareness and initial engagement. Could lead you to focus CRO on landing pages and top-of-funnel content.
- Linear Attribution:
- How it works: Credit is equally distributed across all touchpoints in the conversion path.
- CRO Impact: Provides a balanced view, acknowledging every interaction’s role. Encourages optimization across the entire journey, from initial discovery to final purchase.
- Time Decay Attribution:
- How it works: Touchpoints closer in time to the conversion receive more credit. Credit decreases exponentially as you go further back in the path.
- CRO Impact: Useful for longer sales cycles, where more recent interactions are often more influential. Balances initial discovery with late-stage persuasion.
- Position-Based (U-Shaped) Attribution:
- How it works: Assigns 40% credit to the first and last interactions, and the remaining 20% is distributed evenly among the middle interactions.
- CRO Impact: Recognizes the importance of both discovery and final conversion points. Encourages optimizing both initial landing experiences and crucial last-touch elements like checkout.
- Data-Driven Attribution (DDA):
- How it works: Uses machine learning to algorithmically distribute credit based on actual contribution of each touchpoint. This model often relies on data from Google Analytics 4 (GA4) or other advanced platforms.
- CRO Impact: The most sophisticated approach, often providing the most accurate insights. It helps you understand which touchpoints truly move the needle, allowing for highly targeted CRO experiments and budget allocation.
Choosing the right attribution model (or models, as many businesses use multiple views) is fundamental to correctly interpreting your ecommerce CRO metrics. Without it, you might be optimizing the wrong areas or misjudging the impact of your changes, leading to suboptimal results. Regular review of your attribution model assumptions is a best practice, especially as your marketing mix or customer journey evolves.
[INLINE IMAGE 2: place after fourth H2 | alt=”ecommerce cro metrics comparison illustration”]
Tools and Technologies for Tracking and Analyzing E-commerce CRO Metrics
Effective tracking and analysis of ecommerce CRO metrics are impossible without the right tools. The market offers a vast array of solutions, each specializing in different aspects of data collection, visualization, and experimentation. Integrating these tools creates a powerful ecosystem for identifying optimization opportunities and measuring the success of your CRO efforts.
Analytics Platforms: The Core Data Hub
These platforms are the foundation for tracking virtually all your website’s traffic and conversion data.
- Google Analytics 4 (GA4): As the current standard, GA4 offers a robust, event-driven data model perfect for understanding the full customer journey across devices.
- Setting up Goals and Events: Crucial for tracking specific CRO metrics like “Add to Cart,” “Initiate Checkout,” and “Purchase.” Properly configured events allow for detailed funnel analysis and audience segmentation.
- Custom Reports: GA4’s flexible reporting allows you to create dashboards tailored to your key CRO metrics, providing quick insights into performance.
- Attribution Modeling: As discussed, GA4 offers sophisticated data-driven attribution, helping you understand the real impact of your marketing channels on conversions.
- Shopify Analytics (Built-in Features): For Shopify store owners, the platform’s native analytics dashboard provides immediate access to essential sales, customer, and conversion data. While less granular than GA4, it’s excellent for quick overviews of revenue, AOV, and basic conversion funnels. It integrates seamlessly with Shopify’s ecosystem.
- Other Platforms (e.g., Adobe Analytics): For larger enterprises, platforms like Adobe Analytics offer even more advanced customization, integration capabilities, and robust reporting, often part of a broader marketing cloud solution.
Heatmaps and Session Recordings: Visualizing User Behavior
Quantitative data from analytics tells you what is happening, but heatmaps and session recordings show you why. They provide invaluable qualitative insights into user experience.
- Hotjar: A popular all-in-one tool offering heatmaps (click, scroll, move), session recordings, surveys, and feedback polls. It helps visualize where users click, how far they scroll, and where they encounter friction.
- Crazy Egg: Another strong contender for heatmaps and scroll maps. It’s excellent for understanding user attention and engagement on specific page elements.
- FullStory: Provides high-fidelity session recordings, allowing you to replay user sessions exactly as they happened. It also offers powerful search and segmentation to find specific user journeys that highlight pain points or successful paths.
These tools are indispensable for uncovering UX issues that might not be apparent from numerical data alone, such as confusing layouts, broken elements, or overlooked calls to action.
A/B Testing Tools: Experimentation for Optimization
A/B testing is the cornerstone of data-driven CRO. These tools allow you to create different versions of a web page or element and show them to different segments of your audience to determine which performs better.
- VWO (Visual Website Optimizer): A comprehensive CRO platform offering A/B testing, multivariate testing, server-side testing, and personalization. It includes a visual editor for easy experiment setup.
- Optimizely: A leading enterprise-grade experimentation platform, strong for complex tests, personalization, and advanced feature rollouts.
- Convert.com: An affordable and powerful A/B testing tool, often praised for its excellent customer support and robust features, suitable for businesses of all sizes.
While Google Optimize, a widely used free tool, has been deprecated, the market still offers many excellent alternatives. The key is to select a tool that matches your technical capabilities and testing volume, allowing you to run statistically significant experiments and confidently implement winning variations.
CRM and Marketing Automation: Integrating for CLTV and Segmentation
These tools, while not directly for CRO experimentation, are crucial for leveraging your CRO insights for long-term customer value.
- Klaviyo: A leading marketing automation platform for e-commerce, integrating with Shopify and other platforms. It uses customer data to segment audiences, personalize emails, and automate flows (e.g., abandoned cart reminders, win-back campaigns), directly impacting repeat purchase rates and CLTV.
- Mailchimp, HubSpot: Broader marketing automation and CRM platforms that can manage email lists, segment customers, and track customer interactions over time, feeding into CLTV calculations and personalized CRO efforts.
By effectively using a combination of these tools, e-commerce businesses can gather, analyze, and act on their CRO metrics with precision, leading to continuous improvements in conversion rates and overall profitability.
| Tool Category | Example Tools | Primary Use Case for CRO | Key Benefit |
|---|---|---|---|
| Web Analytics | Google Analytics 4, Shopify Analytics, Adobe Analytics | Quantitative data tracking (traffic, conversions, funnels, revenue) | Comprehensive view of site performance and user flows |
| Heatmaps & Session Recordings | Hotjar, Crazy Egg, FullStory | Qualitative user behavior analysis (clicks, scrolls, navigation) | Visual understanding of user interaction and pain points |
| A/B Testing Platforms | VWO, Optimizely, Convert.com | Controlled experimentation to validate hypotheses | Data-driven decision making and measurable impact on conversion rates |
| Feedback & Survey Tools | Hotjar Surveys, Qualaroo, UserTesting | Direct user feedback and understanding motivations/barriers | Insights into user intent, objections, and desires |
| CRM & Marketing Automation | Klaviyo, Mailchimp, HubSpot | Personalization, segmentation, and post-purchase engagement | Boosting repeat purchases and Customer Lifetime Value (CLTV) |
Strategizing with CRO Metrics: From Data to Actionable Insights
Collecting data on ecommerce CRO metrics is only the first step. The real value comes from transforming that data into actionable insights that drive strategic improvements. This requires a systematic approach to analysis, hypothesis generation, and experimentation.
Identifying Bottlenecks in the Customer Journey
Your conversion funnel is a journey, and every step presents a potential point of friction. By meticulously mapping out the customer journey – from landing on your homepage to completing a purchase – and overlaying your granular CRO metrics, you can identify precisely where users are dropping off. High exit rates on product pages, a sharp decline in “add to cart” after viewing specific categories, or a significant cart abandonment rate are all indicators of bottlenecks. Use tools like GA4’s Funnel Exploration report to visualize these drops. A common area of friction is often the checkout process, especially with unexpected shipping costs or complicated forms. Understanding these points allows you to target your optimization efforts most effectively.
For deeper insights into user experience and potential bottlenecks, consider exploring e-commerce UX best practices to complement your metric analysis.
Prioritizing Optimization Efforts: Impact vs. Effort
Once you’ve identified multiple potential areas for improvement, you can’t optimize everything at once. Prioritization is key. A useful framework is the “Impact vs. Effort” matrix:
- High Impact, Low Effort: These are your “quick wins.” Small changes that can yield significant results (e.g., optimizing button copy, improving page load speed on a critical page). Prioritize these first.
- High Impact, High Effort: These are strategic projects that require substantial resources but promise substantial returns (e.g., a complete checkout flow redesign, implementing advanced personalization). Plan these carefully.
- Low Impact, Low Effort: Minor tweaks with minimal expected return. Do these if time allows, but don’t prioritize over high-impact tasks.
- Low Impact, High Effort: Avoid these. They consume resources without promising much in return.
This systematic approach ensures your team’s energy is directed towards changes that will have the most meaningful impact on your ecommerce CRO metrics.
Segmenting Your Audience for Targeted CRO
Not all visitors are created equal, and a one-size-fits-all approach to CRO often falls short. Segmenting your audience allows you to tailor your optimization efforts to specific groups, leading to more effective results. Common segmentation approaches include:
- New vs. Returning Customers: New visitors might need more reassurance and clear navigation, while returning customers might respond better to loyalty incentives or personalized recommendations.
- Device Segmentation: Mobile users often have different browsing habits and expectations than desktop users. Optimizing for mobile conversion rates is crucial, as a significant portion of e-commerce traffic originates from smartphones.
- Geographic Segmentation: Different regions may have varying preferences for payment methods, shipping options, or even product types.
- Traffic Source: Visitors from paid ads might have higher intent than those from social media, requiring different landing page experiences.
By analyzing CRO metrics within these segments, you can uncover unique pain points and implement targeted optimizations that resonate more deeply with each group.
A/B Testing Hypotheses Based on Metric Deviations
Once you’ve identified a bottleneck and prioritized an optimization, the next step is to formulate a hypothesis and test it. A good hypothesis follows a structure like: “If I [make this change] for [this segment], then [this metric] will [increase/decrease] because [of this reason].”
For example: “If I simplify the checkout form to a single page for mobile users, then the cart abandonment rate will decrease because fewer steps reduce perceived effort.”
Use your A/B testing tools to implement and run these tests. It’s critical to ensure statistical significance before drawing conclusions. Small sample sizes or short test durations can lead to misleading results. Once a winning variation is identified, implement it permanently and continue the optimization loop. This rigorous, data-backed approach ensures that every change you make is a step towards higher conversion rates and increased profitability.
Advanced CRO Metrics and Predictive Analytics for Future Growth
As your e-commerce store matures and your understanding of foundational CRO metrics deepens, you can begin to explore more advanced metrics and predictive analytics. These go beyond immediate conversions to focus on long-term profitability, customer retention, and proactive optimization strategies.
Customer Acquisition Cost (CAC) vs. CLTV Ratio: The True Profitability Gauge
While CLTV is a vital metric on its own, its relationship with Customer Acquisition Cost (CAC) provides the clearest picture of your customer-level profitability.
CAC: The total cost of sales and marketing needed to acquire one new customer.
CLTV:CAC Ratio: Customer Lifetime Value / Customer Acquisition Cost
A ratio of 3:1 (meaning CLTV is three times CAC) is often considered healthy. A ratio below 1:1 indicates you’re losing money on each customer. A very high ratio (e.g., 5:1 or more) might suggest you could invest more in acquisition. By optimizing CRO metrics that boost CLTV (like repeat purchase rate, AOV) and simultaneously working to reduce CAC, you ensure sustainable, profitable growth.
Churn Rate: Identifying and Preventing Customer Loss
Churn rate measures the percentage of customers who stop purchasing from your store over a given period. For subscription-based e-commerce or businesses relying on repeat purchases, this is a critical metric.
Calculation: (Number of Lost Customers / Total Customers at Start of Period) x 100%
High churn suggests issues with product satisfaction, customer service, or competitive offerings. CRO efforts aimed at improving post-purchase experience, personalized communication, and loyalty programs can significantly reduce churn, directly impacting CLTV. Understanding customer retention strategies is crucial for managing churn effectively.
Return Rate/Refund Rate: Impact on Net Revenue and Customer Trust
This metric calculates the percentage of sold products that are returned or refunded. While often viewed as an operational concern, it has significant CRO implications.
Calculation: (Number of Returned Items / Total Items Sold) x 100%
High return rates can erode net revenue and impact customer trust. CRO efforts in this area involve optimizing product descriptions, improving product photography and videos, providing accurate sizing guides, and clear expectation setting to minimize discrepancies between product perception and reality. A low return rate can be a powerful trust signal that enhances future conversion rates.
Predictive CRO and AI in E-commerce: Anticipating Future Behavior
Moving beyond historical data, predictive analytics leverages machine learning and AI to forecast future customer behavior. This allows for proactive CRO strategies.
- Personalization Engines: AI-powered recommendations (products, content) based on browsing history and similar customer profiles can significantly increase conversion rates and AOV.
- Dynamic Pricing: Adjusting product prices in real-time based on demand, inventory levels, competitor pricing, and user segments can optimize revenue and conversion.
- Churn Prediction: Identifying customers at risk of churning before they leave, allowing for targeted retention campaigns.
- Cart Abandonment Prevention: AI can analyze user behavior in real-time to predict abandonment and trigger proactive interventions like personalized pop-ups or chat offers.
Implementing these advanced techniques allows e-commerce businesses to move from reactive optimization to proactive engagement, creating a truly optimized and future-ready online store. For D2C brands, this level of personalization and foresight can be a major competitive advantage.
Common Challenges and Best Practices in E-commerce CRO Metric Analysis
While the potential rewards of a robust CRO strategy are immense, the path is not without its challenges. Navigating these obstacles effectively is key to ensuring your CRO efforts yield consistent, meaningful results.
Data Overload and Irrelevance: Focusing on True KPIs
One of the biggest pitfalls in CRO is “analysis paralysis” – being overwhelmed by the sheer volume of data available. It’s easy to get lost in vanity metrics (e.g., page views, number of social media followers) that don’t directly correlate with business objectives.
Best Practice: Define your Key Performance Indicators (KPIs) upfront. Focus on metrics directly tied to your overarching goals (e.g., Conversion Rate, AOV, CLTV, Cart Abandonment Rate). Use dashboards to visualize these critical metrics clearly, filtering out the noise. Regular reviews should focus on these core KPIs, drilling down into supporting metrics only when anomalies appear. Remember, data is only