Updated May 2026. Grasping the intricacies of ecommerce supply chain management is often the deciding factor between a digital storefront that thrives and one that buckles under sudden market pressure. When an online retailer scales, the backend operations—encompassing everything from raw material sourcing to final home delivery—must evolve in tandem to protect profit margins and foster long-term customer loyalty. You are not merely moving boxes across a map; you are orchestrating a complex, interrelated network that directly dictates your competitive advantage and market share.
In the modern retail environment, evolving consumer expectations demand rapid fulfillment, transparent tracking, and seamless returns. Building a resilient web store operations framework allows businesses to absorb global sourcing shocks, maintain operational agility, and keep costs strictly controlled. By aligning physical product flow with strategic digital growth goals, retailers transform their logistics from a basic cost center into a powerful revenue-driving asset.
What Are the Core Components of a Digital Commerce Logistics Network?
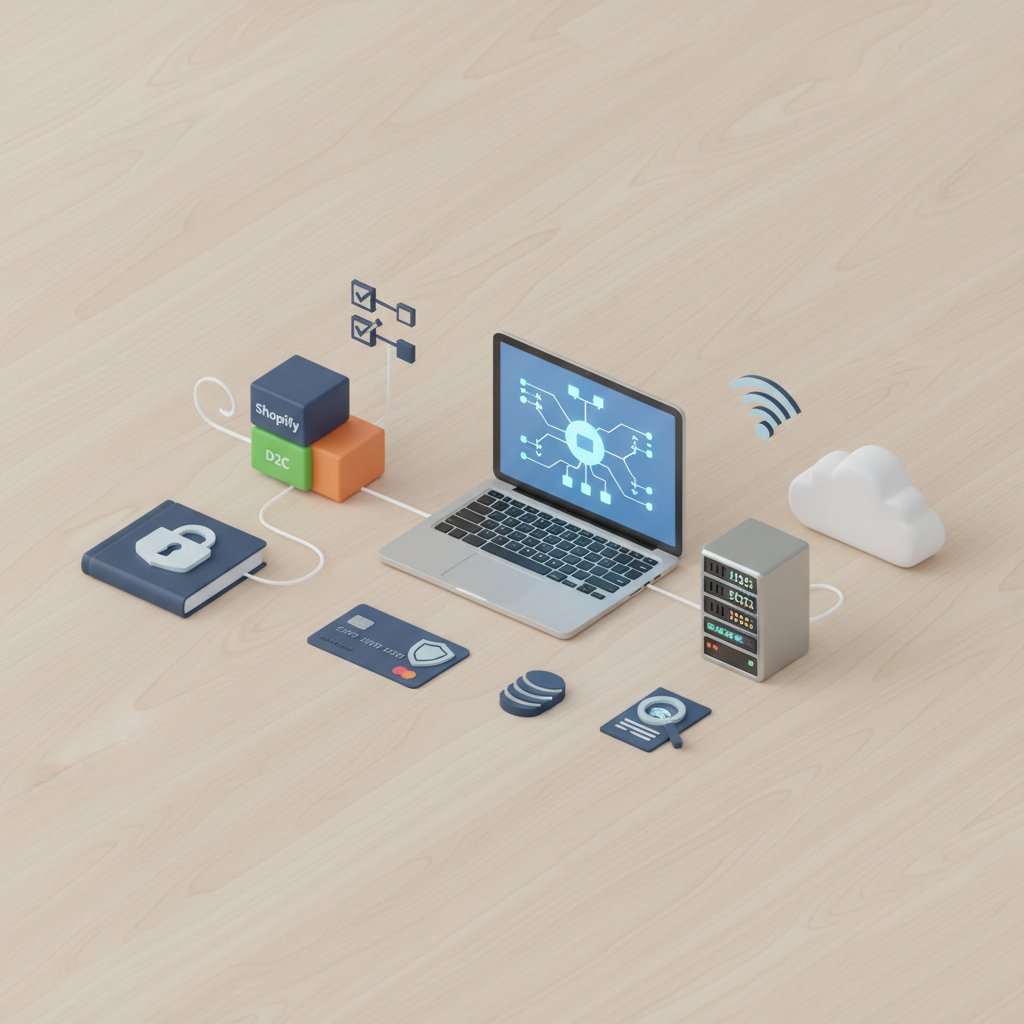
A robust digital commerce distribution framework consists of several tightly integrated nodes working in unison to move products from manufacturers to end consumers. The journey begins with strategic sourcing and procurement, securing reliable suppliers who can meet quality standards and lead times. Next, warehousing and inventory control dictate how goods are stored, allocated, and tracked to prevent stockouts or overstock scenarios. Order fulfillment then takes over, initiating the picking, packing, and dispatching processes the moment a transaction clears.
Integrating these operational nodes eliminates data latency, preventing scenarios where a digital storefront sells items that are physically unavailable in the warehouse. For example, a customer adds a high-demand custom ergonomic chair to their cart, completes the checkout, and instantly receives an accurate delivery window because the inventory database perfectly mirrors physical stock levels. According to a 2026 study by Forrester Research, highly integrated logistics networks experience a 34% reduction in order processing delays.
A critical, often overlooked component is Reverse Logistics. This involves the systematic intake, inspection, and processing of returned merchandise. When a shopper sends an item back, swift reverse processing routes the product back into active inventory or flags it for refurbishment, rescuing capital that would otherwise remain tied up in transit limbo.
What success looks like: Achieving a 99.5% order accuracy rate alongside a consistent two-day transit window, with returns processed and refunded within 24 hours of warehouse receipt. For a deeper dive into backend structural planning, consult our guide on comprehensive backend operational strategies.
Architecting an Effective Web Store Operations Strategy
Distributing inventory strategically across multiple fulfillment centers cuts last-mile transit times by up to 22% (McKinsey, 2026). The strategic placement of goods close to high-density customer clusters reduces shipping zones, thereby slashing carrier costs. Implementing an Omnichannel Fulfillment approach ensures that inventory is not siloed by sales channel; a product can be shipped from a central warehouse, a regional 3PL, or even directly from a brick-and-mortar retail location depending on proximity to the buyer.
When physical storage is misaligned with regional demand, carrying costs soar while delivery speeds plummet. Consider a retailer launching a winter apparel line: housing the entire coat inventory in a Florida facility forces expensive, expedited shipping to core buyers in New York and Chicago. Instead, staging the bulk of the seasonal inventory in a Midwest hub drastically shortens the final delivery leg, lowering costs and improving customer satisfaction.
| Fulfillment Model | Description | Pros (Cost & Control) | Best For |
|---|---|---|---|
| In-House Warehousing | Company owns and operates its own storage and fulfillment centers. | Total brand control; lower per-order cost at high volumes. | Established brands with predictable, high-volume sales. |
| Third-Party Logistics (3PL) | Outsourcing storage, packing, and shipping to specialized partners. | High scalability; no massive initial infrastructure investment. | Growing mid-market merchants expanding geographically. |
| Dropshipping | Manufacturer ships directly to the end consumer on behalf of the retailer. | Zero inventory holding costs; ultimate geographic flexibility. | Startups testing new product categories. |
To further refine your structural approach, explore our dedicated breakdown on optimizing your storage facilities and automation.
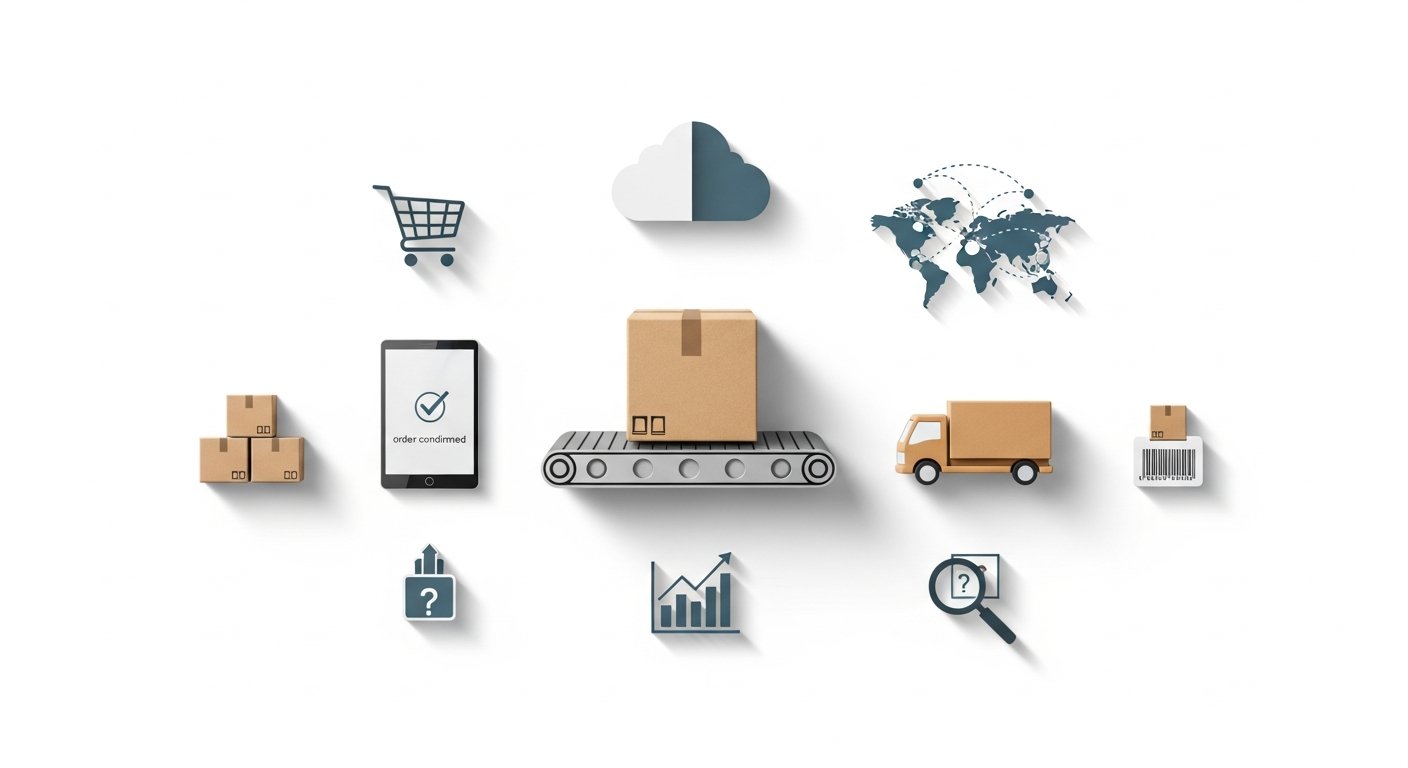
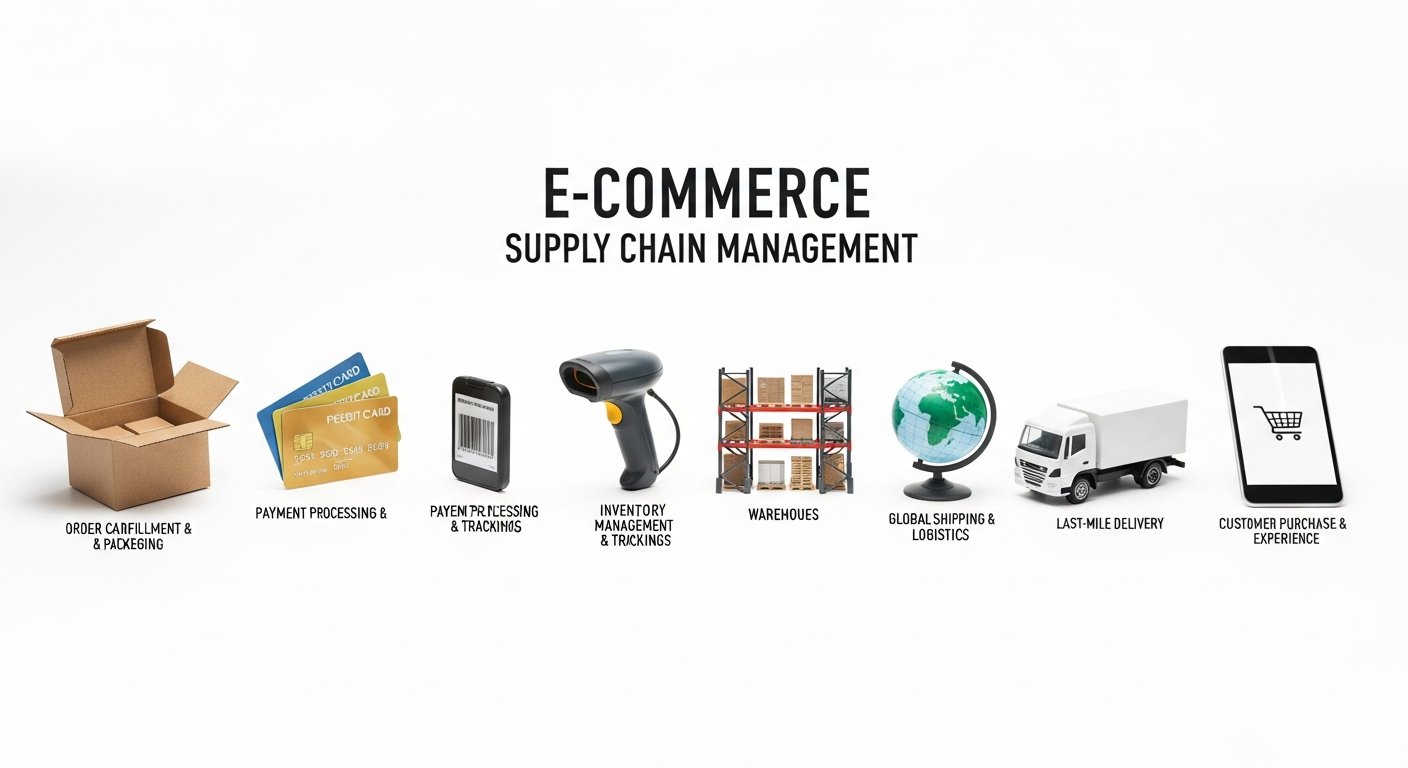
[INLINE IMAGE 2: diagram comparing single-node versus multi-node inventory distribution networks]
How Does Technology Drive Internet Sales Distribution?
Picture a localized holiday demand spike where a specific toy suddenly goes viral in the Pacific Northwest. An intelligent Order Management System (OMS) detects the surge, utilizes an Order Routing Algorithm, and automatically shifts fulfillment directives to the Seattle and Portland 3PL facilities, preventing the default California hub from depleting its safety stock. This seamless reallocation occurs without human intervention, preserving both margins and delivery promises.
According to Gartner (2025) [VERIFICAR FECHA], AI-driven demand forecasting improves supply network efficiency by 15%. This improvement occurs because machine learning models analyze historical sales data, seasonal trends, and even localized weather patterns to predict buying behavior accurately, rather than relying on static, backward-looking spreadsheets. The technology identifies subtle correlative patterns that human operators miss, ensuring procurement orders are placed weeks ahead of anticipated localized demand.
Technology also bridges the gap between disparate software tools. Enterprise Resource Planning (ERP) systems act as the central nervous system, connecting the digital storefront’s sales data directly to warehouse management software. When these systems communicate instantaneously, the risk of overselling out-of-stock items drops to near zero.
Essential Tech Stacks for E-tail Scalability
- Warehouse Management Systems (WMS): Software that directs inventory put-away, optimizes picking routes, and manages warehouse staff productivity.
- Demand Planning AI: Tools that parse thousands of data points to recommend exact reorder quantities and dates.
- Automated Picking Robots: Hardware solutions that retrieve bins from dense storage grids, bringing goods directly to human packers to eliminate walking time.
Key Performance Indicators for E-tail Supply Chain Solutions
Establishing a baseline of operational health requires tracking strict, quantifiable metrics that align with broader business growth objectives. Without precise data, scaling operations becomes a guessing game fraught with expensive errors. The most impactful metric to monitor is the Perfect Order Rate, which calculates the percentage of orders delivered to the right place, with the right product, at the right time, in pristine condition, and with accurate documentation.
Our experience shows that shifting focus from generic shipping volume to localized order defect rates uncovers hidden friction points in the packaging process. For instance, if the defect rate spikes specifically for fragile glass items shipped from a newly onboarded regional warehouse, managers can pinpoint the exact packing station causing the breakage rather than overhauling the entire national shipping policy.
According to the Council of Supply Chain Management Professionals (2026), top-performing retailers maintain a perfect order index of 95% or higher. Monitoring inventory turnover ratio is equally vital. This metric reveals how many times a business sells and replaces its stock over a given period. High turnover indicates strong sales and efficient purchasing, whereas low turnover points to bloated, stagnant inventory.
| KPI | Definition | Why it Matters for Growth | Target Benchmark |
|---|---|---|---|
| Order Lead Time | Total time from customer checkout to package delivery. | Directly impacts customer retention and lifetime value. | Under 3 days (domestic). |
| Inventory Carrying Cost | Total expense of holding unsold goods (rent, insurance, depreciation). | Eats directly into profit margins; highlights dead stock issues. | 15% – 20% of inventory value. |
| Return Processing Time | Hours/days taken to inspect and restock a returned item. | Dictates how quickly capital is recovered and inventory is resold. | Under 24 hours. |
What failure looks like: Carrying costs exceeding 30% of total inventory value, driven by obsolete merchandise consuming expensive warehouse shelving space. Executing these metrics requires dedicated personnel; learn more about assembling skilled logistics personnel to manage these KPIs.
[INLINE IMAGE 4: dashboard graphic showing order accuracy, fulfillment cost per order, and inventory turnover rate]
Strategies for Managing High-Volume Returns
Processing reverse inventory swiftly prevents seasonal products from depreciating into unsellable dead stock. When a returned winter coat is inspected, cleaned, and restocked within 24 hours, it can immediately fulfill another customer’s order during the peak cold season. Delaying that same return by two weeks might push the coat past its prime selling window, forcing the retailer to liquidate it at a steep discount.
The National Retail Federation reports that average e-commerce return rates currently sit around 16.5% (NRF, 2026). Given this massive volume, implementing a clear Restocking Fee Threshold—where returns initiated after a specific grace period incur a small processing charge—can help offset labor costs while subtly encouraging buyers to return unwanted goods faster.
Imagine a scenario where a shopper purchases three different sizes of a premium dress to ensure the right fit, intending from the start to return two. If the retailer uses an automated self-service return portal, the shopper instantly prints a QR code and drops the package at a local pharmacy. The return software immediately notifies the warehouse that two specific SKUs are inbound, allowing the demand planning system to pause reorders for those sizes.
Integrating advanced software is crucial for tackling high return rates effectively. Dive deeper into automated reverse logistics platforms to protect your bottom line.
Common Mistakes in Digital Storefront Inventory and Delivery
Even well-funded online businesses often stumble by neglecting foundational logistics principles. Effective ecommerce supply chain management requires constant vigilance to avoid expensive systemic pitfalls. One widespread error is supplier over-reliance. When a single manufacturing partner in Asia experiences a sudden factory shutdown due to an unseasonal typhoon, a brand lacking diversified sourcing can find its entire Q4 inventory paralyzed, leading to catastrophic stockouts during the most profitable quarter of the year.
Supplier diversification actively prevents single points of failure by spreading manufacturing risk across multiple geographical zones. If one node goes dark, secondary suppliers immediately scale production to cover the deficit. Another critical error is failing to reconcile digital stock counts with physical reality, leading to Phantom Inventory. This occurs when the website displays items as in-stock, but the warehouse bins are completely empty.
Key Pitfalls to Avoid
- Ignoring dimensional weight pricing: Shipping small, dense items in excessively large boxes incurs massive carrier penalties. Audit your packaging sizes regularly.
- Siloed departmental communication: When the marketing team launches a massive flash sale without warning the warehouse manager, the resulting order spike overwhelms packing staff, causing massive shipping delays.
- Manual data entry: Relying on human operators to copy shipping addresses from an ecommerce platform to a carrier portal virtually guarantees typos and misdelivered packages.
- Neglecting raw material tracking: Focusing solely on finished goods while ignoring the lead times of the raw components needed to manufacture them.
Avoiding these critical missteps starts from day one. If you are in the planning phases, ensure you are laying a resilient foundational supply network right from the beginning.
The Future of E-business Fulfillment Capabilities
The trajectory of internet sales distribution is heavily tilting toward extreme proximity and hyper-automation. Micro-fulfillment centers (MFCs) placed directly within dense urban zones are drastically reducing last-mile delivery emissions because delivery fleets travel significantly shorter, more consolidated routes. Rather than dispatching a gas-powered van on a thirty-mile suburban loop, couriers use electric cargo bikes to distribute packages from an MFC located just blocks away from the end consumers.
A recent report indicates that urban micro-fulfillment cuts last-mile delivery costs by up to 50% (CBRE, 2026). This staggering cost reduction stems from bypassing traditional regional sorting hubs and holding high-velocity SKUs practically at the customer’s doorstep. This evolution signifies a broader industry shift toward green logistics, where reducing carbon footprints aligns perfectly with reducing transit expenses.
Mastering ecommerce supply chain management in this decade requires an unyielding commitment to technological adoption and operational flexibility. What success looks like in 2026 and beyond: A seamlessly integrated network where AI predicts demand surges, robots handle high-density warehouse picking, and eco-friendly final-mile solutions ensure profitable, sustainable delivery. Online retailers that treat their distribution networks as strategic growth engines rather than mere operational expenses will definitively capture the lion’s share of the digital marketplace.
Sources & References
- Forrester Research. (2026). The State of Unified Retail Supply Chains. Forrester Analyst Reports.
- McKinsey & Company. (2026). Next-Generation Fulfillment: Unlocking Growth in Digital Retail. McKinsey Operations Practice.
- Gartner, Inc. (2025). Magic Quadrant for Supply Chain Planning Solutions. [VERIFICAR FECHA]
- Council of Supply Chain Management Professionals (CSCMP). (2026). Annual State of Logistics Report.
- National Retail Federation (NRF). (2026). Consumer Returns in the Retail Industry.