Ecommerce Analytics Tools: Your Ultimate Guide for D2C & Shopify Growth in 2026
By e-comprofits Editorial Team — Senior editors with 10+ years of subject-matter experience. Published 2026-05-26 · Last Updated 2026-05-26
Affiliate disclosure: This article may contain affiliate links. Recommendations are independent and editorially driven.
TL;DR:
Ecommerce analytics tools are indispensable for D2C and Shopify brands, transforming raw data into actionable insights for optimized operations, marketing, and profitability.
Beyond basic traffic, these tools provide deep dives into customer behavior, sales performance, marketing ROI, and operational efficiency, leveraging both quantitative (“what”) and qualitative (“why”) data.
Top tools include GA4, Hotjar, Mixpanel, Heap, Klaviyo, Triple Whale, and Shopify Analytics, each offering unique strengths for different analytical needs and business scales.
Choosing the right stack involves assessing your specific goals, platform (Shopify, headless D2C), budget, and integration needs, moving towards a unified data view for comprehensive insights.
Effective implementation requires a clear tracking plan, continuous optimization through A/B testing, and a proactive approach to addressing challenges like data overload and attribution complexity to unlock sustained e-commerce profit potential.
In the fiercely competitive landscape of 2026, the success of any direct-to-consumer (D2C) brand or Shopify store hinges on its ability to understand and react to data. Gone are the days when guesswork or intuition alone could drive sustainable growth. Today, conversion rate optimization strategies for D2C brands, efficient marketing spend, and superior customer experiences are all fueled by one critical element: sophisticated ecommerce analytics tools. These powerful platforms are the compass guiding online businesses through the vast ocean of customer interactions, sales funnels, and marketing campaigns, revealing pathways to increased profitability and enduring customer loyalty.
This comprehensive guide from e-comprofits is engineered for e-commerce operators, marketers, and founders who are ready to elevate their data strategy. We’ll delve into the nuances of various ecommerce analytics software, explore how they empower businesses to make informed decisions, and provide actionable insights into building an analytics stack that truly drives D2C growth and Shopify optimization. Prepare to transform your approach from simply collecting data to intelligently leveraging it for maximum impact.
The Imperative of Ecommerce Analytics in Today’s Digital Landscape
The digital storefront of 2026 is a dynamic environment, constantly shifting with evolving consumer behaviors, new technological advancements, and increasing privacy regulations. For D2C brands and Shopify merchants, merely existing online is no longer enough; survival and prosperity demand a deep, nuanced understanding of every digital interaction. This is where ecommerce analytics tools become not just beneficial, but absolutely imperative.
Navigating the Complexities of Online Retail
The journey a customer takes from discovery to purchase, and beyond, is rarely linear. It spans multiple devices, channels, and touchpoints. Without precise data, understanding where customers drop off, what motivates a purchase, or which marketing efforts genuinely drive ROI is like navigating a maze blindfolded. Ecommerce analytics provide the visibility needed to decode these complex journeys, identify friction points, and uncover hidden opportunities.
For instance, a D2C brand selling sustainable fashion might initially struggle to understand why their social media campaigns lead to high website traffic but low conversion rates. Robust ecommerce analytics can pinpoint the exact stage in the user journey where users abandon their carts – perhaps a cumbersome checkout process, unexpected shipping costs, or a lack of trust signals on product pages. Without these tools, such critical insights would remain elusive, leading to wasted marketing spend and stagnant growth.
From Data Deluge to Actionable Insights
Every click, scroll, page view, and purchase generates a mountain of data. The challenge isn’t a lack of information, but rather the ability to distill this “data deluge” into actionable insights. This is the core promise of modern ecommerce analytics software. They don’t just present numbers; they contextualize them, revealing patterns, trends, and correlations that would be impossible to identify manually.
Consider an online store experiencing a dip in repeat purchases. Instead of broad assumptions, an advanced analytics tool can segment customers by purchase history, demographics, and engagement levels, revealing that customers who bought a specific product category are less likely to return, perhaps due to a product quality issue or insufficient post-purchase support. This specific, actionable insight empowers the brand to target remedial actions, whether it’s improving a product line or enhancing customer service for that segment.
Ultimately, ecommerce analytics moves businesses beyond reactive problem-solving to proactive strategic planning. It enables D2C brands to anticipate customer needs, personalize experiences, optimize their supply chains, and fine-tune their marketing messages, all leading to a healthier bottom line and a stronger competitive edge in 2026.
What Exactly Are Ecommerce Analytics Tools?
At their core, ecommerce analytics tools are specialized software applications designed to collect, process, analyze, and present data related to online store performance, customer behavior, and marketing effectiveness. They serve as the digital brain of an e-commerce operation, translating raw transactional and behavioral data into digestible, actionable intelligence.
Beyond Basic Traffic: A Holistic View of Your Store
Many people associate “analytics” with simple website traffic numbers – visitors, page views, bounce rates. While these are foundational metrics, modern ecommerce analytics tools go far beyond. They provide a holistic, 360-degree view of an online business, encompassing:
Customer Journey Analysis: Tracking users from their first touchpoint (e.g., an ad click) through their browsing behavior, cart additions, checkout process, and post-purchase engagement.
Sales and Revenue Performance: Detailed breakdowns of product performance, average order value (AOV), lifetime value (LTV), conversion rates at various funnel stages, and profitability by product or segment.
Marketing Campaign Effectiveness: Attribution modeling to understand which channels, campaigns, and keywords drive actual sales and return on ad spend (ROAS).
Website User Experience (UX): Identifying areas of friction, popular content, and navigational patterns to optimize site design and functionality.
Operational Insights: Understanding inventory turns, shipping costs, and refund rates as they relate to overall profitability.
This comprehensive scope allows businesses to connect disparate data points, identifying how, for example, a specific ad campaign impacts product views, which in turn influences add-to-cart rates, and ultimately, overall revenue. It’s about seeing the entire ecosystem, not just isolated components.
[INLINE IMAGE 1: place after second H2 | alt=”ecommerce analytics tools concept illustration”]
The Pillars of Modern Ecommerce Analytics
While the specific features vary between platforms, most robust ecommerce analytics software is built upon several key pillars:
Data Collection: This is the foundation. Tools use tracking codes (like JavaScript snippets, pixels, or server-side APIs) to collect data points about user interactions (clicks, scrolls, form submissions), transactions (purchases, refunds), and user demographics/technology (browser, device, location).
Data Processing & Storage: Raw data is cleaned, structured, and stored in databases, often in real-time or near real-time, making it ready for analysis.
Reporting & Visualization: This is where the magic happens for users. Tools transform complex data into easily understandable dashboards, charts, graphs, and tables. Customizable reports allow users to focus on the metrics most relevant to their goals.
Segmentation: A crucial feature allowing users to divide their audience and data into meaningful groups (e.g., new vs. returning customers, high-value purchasers, users from specific geographic regions) to uncover nuanced behaviors and opportunities.
Funnel Analysis: Visualizing the steps users take to complete a desired action (e.g., product view > add to cart > checkout > purchase) and identifying where users drop off, indicating areas for optimization.
Attribution Modeling: Helping businesses understand which marketing touchpoints contribute to a conversion. This can range from simple last-click attribution to more complex multi-touch models.
Alerts & Anomalies Detection: Proactive notifications when key metrics deviate from expected patterns, allowing for quick identification and response to issues or opportunities.
By leveraging these pillars, D2C brands can move beyond guesswork, making data-driven decisions that enhance customer satisfaction, optimize marketing spend, and ultimately drive sustainable growth and profitability in an increasingly competitive digital marketplace.
Key Metrics and KPIs Unlocked by Robust Ecommerce Analytics Software
Understanding which metrics and Key Performance Indicators (KPIs) to track is as crucial as having the right ecommerce analytics tools. These metrics provide a quantifiable measure of your online store’s health and performance, guiding strategic decisions and pinpointing areas for improvement. Effective online store analytics go beyond surface-level numbers, offering deep insights into every facet of your business.
Sales Performance & Revenue Metrics
These are often the first metrics e-commerce businesses look at, providing a direct snapshot of financial success. However, robust analytics reveal the drivers behind these numbers.
Gross Merchandise Value (GMV) / Total Revenue: The total value of all goods sold over a period. This foundational metric is often segmented by product, category, or customer type.
Average Order Value (AOV): The average amount spent per customer order. Increasing AOV through strategies like upselling, cross-selling, or minimum order free shipping is a common goal.
Conversion Rate (CR): The percentage of website visitors who complete a desired action, typically a purchase. This is a crucial indicator of your site’s effectiveness and is often tracked at various funnel stages (e.g., add-to-cart rate, checkout completion rate).
Customer Lifetime Value (CLTV/LTV): The predicted total revenue a customer will generate throughout their relationship with your business. High LTV indicates strong customer retention and loyalty, a cornerstone of D2C profitability.
Repeat Purchase Rate: The percentage of customers who return to make additional purchases. A high rate signifies customer satisfaction and brand stickiness.
Refund Rate & Return Rate: The percentage of orders that are returned or refunded. High rates can indicate product quality issues, misleading descriptions, or problems with fulfillment.
Gross Profit & Net Profit: While not purely an analytics metric, many advanced tools integrate with financial data to provide an accurate profit picture after COGS, operating expenses, and marketing spend. This is particularly relevant for understanding multi-channel attribution models in e-commerce and their true ROI.
Customer Behavior & Engagement Metrics
These metrics reveal how users interact with your Shopify store or D2C website, offering clues for optimizing user experience and content.
Sessions & Users: The number of visits to your site and the number of unique individuals making those visits.
Page Views & Pages per Session: How many pages users view on average during a session, indicating engagement.
Time on Site / Session Duration: The average length of a user’s visit. Longer durations often correlate with higher engagement.
Bounce Rate: The percentage of visitors who leave your site after viewing only one page. A high bounce rate can signal irrelevant traffic, poor landing page design, or slow loading times.
Exit Rate: The percentage of visitors who leave your site from a specific page, regardless of how many pages they viewed prior. High exit rates on crucial pages (like product pages or checkout steps) indicate points of friction.
Scroll Depth: How far down a page users scroll, indicating content engagement.
Heatmaps & Click Maps: Visual representations of where users click, move their mouse, or focus their attention on a page, providing invaluable qualitative insights.
Funnel Drop-offs: Identifying where users abandon the purchase path (e.g., from product page to cart, or from cart to checkout).
Marketing & Acquisition Efficiency Metrics
These KPIs are vital for optimizing your marketing spend and understanding the true ROI of your campaigns.
Cost Per Acquisition (CPA): The average cost to acquire one new customer. Lower CPA indicates more efficient marketing.
Return on Ad Spend (ROAS): The revenue generated for every dollar spent on advertising. A critical metric for evaluating campaign effectiveness.
Customer Acquisition Cost (CAC): Similar to CPA but often includes all sales and marketing costs, not just ad spend, to acquire a customer. Comparing CAC to LTV is essential for long-term profitability.
Traffic by Channel: Understanding which channels (organic search, paid ads, social media, email, direct) drive the most traffic and, more importantly, the most qualified traffic.
Attribution Models: Analyzing which touchpoints (e.g., first click, last click, linear, time decay) contributed to a conversion, providing a more nuanced view of marketing impact.
Operational & Profitability Metrics
Beyond sales and marketing, ecommerce analytics can shed light on operational efficiency that directly impacts the bottom line.
Inventory Turnover: How quickly inventory is sold and replaced. Slow turnover can tie up capital, while fast turnover indicates popular products.
Shipping Cost Per Order: Tracking this helps optimize shipping strategies and pricing.
Customer Service Interactions Per Order: High numbers can indicate product issues or confusing website information.
By diligently tracking and analyzing these varied metrics with your chosen ecommerce analytics tools, you gain a powerful lens into your D2C or Shopify operation. This data-driven approach allows for targeted improvements, leading to increased customer satisfaction, reduced costs, and ultimately, significantly enhanced profitability.
Types of Ecommerce Analytics Tools: A Categorized Approach
The world of ecommerce analytics is diverse, offering a spectrum of tools designed to address different aspects of online business performance. Broadly, these tools can be categorized by the type of data they specialize in collecting and analyzing: quantitative or qualitative. Understanding this distinction is key to building a comprehensive analytics stack.
Quantitative Analytics Platforms: The “What”
Quantitative analytics tools focus on numbers, statistics, and measurable events. They answer questions like “What happened?”, “How many?”, and “Where?”. These platforms are excellent for identifying trends, measuring performance against KPIs, and understanding user paths on a large scale.
Characteristics:
Numerical Data: Rely on metrics such as page views, clicks, conversion rates, revenue, session duration, bounce rate, etc.
Large Scale: Designed to process and analyze vast amounts of data from thousands or millions of users.
Statistical Analysis: Often include features for segmentation, funnel analysis, cohort analysis, and attribution modeling.
Tracking overall website performance and traffic sources.
Measuring the effectiveness of marketing campaigns (ROAS, CPA).
Identifying popular products, categories, and content.
Detecting conversion funnel drop-offs at a high level.
A/B testing outcomes and statistical significance.
Qualitative Analytics Platforms: The “Why”
Qualitative analytics tools delve into the user experience to understand the motivations, frustrations, and thought processes behind the numbers. They answer questions like “Why did that happen?”, “How do users feel?”, and “What are users trying to achieve?”. These tools provide context and human insight that quantitative data alone cannot offer.
Characteristics:
Behavioral Data: Focus on user actions and perceptions rather than just outcomes.
Visualizations: Often use heatmaps, session recordings, and form analytics.
Direct Feedback: Incorporate surveys, polls, and user interviews.
Smaller Scale: While they can capture data from many users, the analysis is often more granular, focusing on individual user journeys or specific page interactions.
Understanding why users abandon a checkout process (e.g., confusion, trust issues).
Identifying areas of friction on a product page (e.g., unclear CTAs, unread content).
Gathering direct feedback on new features or website changes.
Optimizing forms for better completion rates.
Gaining empathy for the user experience.
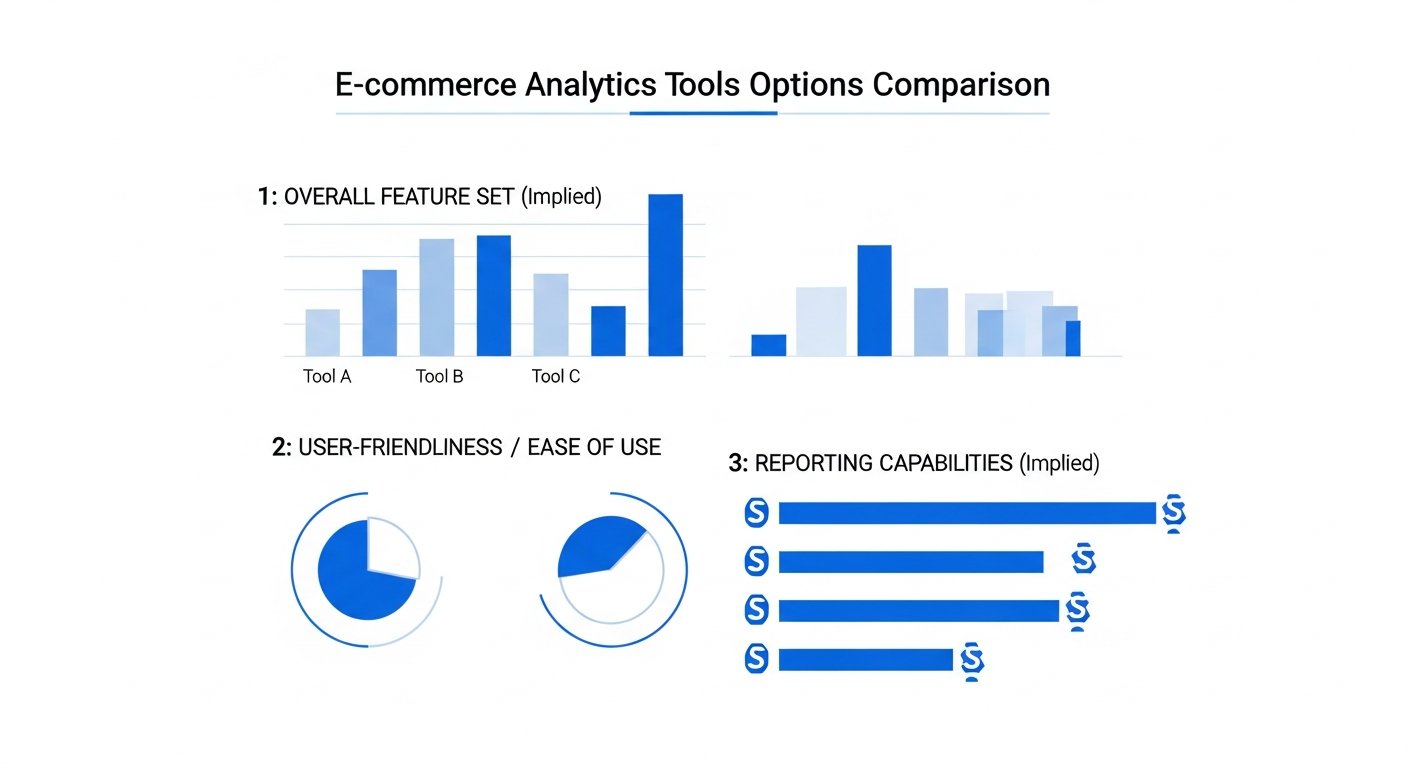
[INLINE IMAGE 2: place after fourth H2 | alt=”ecommerce analytics tools comparison illustration”]
All-in-One vs. Specialized Solutions
Beyond the quantitative/qualitative divide, tools also differ in their breadth of features:
All-in-One Platforms: These aim to provide a comprehensive suite of analytics capabilities, often combining aspects of both quantitative and qualitative analysis, alongside marketing automation, attribution, and sometimes even financial reporting. They are appealing for their integrated approach, reducing the need to juggle multiple subscriptions and data sources. Examples include Triple Whale, HubSpot’s CRM Suite, and some enterprise-level platforms.
Specialized Solutions: These tools excel in a particular niche, offering unparalleled depth in their specific area. For instance, a tool like Hotjar is exclusively focused on qualitative user behavior, while a tool like Ahrefs focuses solely on SEO analytics. Many D2C brands build their analytics stack by combining several specialized tools that integrate well, leveraging the “best of breed” for each function.
The optimal analytics strategy for a Shopify store or D2C brand often involves a blend of these tool types. A strong quantitative foundation (like GA4) provides the “what,” while a qualitative tool (like Hotjar) explains the “why.” This combined approach offers a holistic understanding of your customers and business performance, enabling truly data-driven decisions that propel growth and profitability.
Top Ecommerce Analytics Tools for D2C & Shopify Stores (Comparison & Deep Dive)
Choosing the right ecommerce analytics tools is a pivotal decision for any D2C brand or Shopify merchant. The market is saturated with options, each boasting unique features and strengths. Here, we’ll dive into some of the leading platforms, highlighting their core functionalities, ideal use cases, and how they contribute to a robust online store analytics strategy.
Google Analytics 4 (GA4): The Industry Standard for Online Store Analytics
Google Analytics 4 (GA4) represents a significant shift in how Google approaches web and app analytics. Moving from the session-based model of Universal Analytics, GA4 is an event-driven platform designed for a future with less reliance on cookies, offering a unified view of the customer journey across websites and apps. It’s an indispensable tool for deep online store analytics.
Strengths & Key Features
Event-Based Data Model: Every interaction (page view, click, scroll, purchase) is an event, allowing for highly flexible and detailed tracking of user behavior. This is particularly powerful for D2C brands with complex user journeys.
Cross-Platform Tracking: Unifies data from websites and mobile apps into a single property, providing a comprehensive view of the customer lifecycle.
Enhanced Ecommerce Reporting: Offers detailed reports on product performance, sales revenue, checkout behavior, and shopping cart analysis.
AI-Powered Insights: Utilizes machine learning to surface predictive metrics (e.g., churn probability, purchase probability) and automatically detect significant trends or anomalies.
BigQuery Export: For advanced users, GA4 allows free export of raw event data to Google BigQuery, enabling highly customized analysis and integration with other data sources.
Privacy-Centric Design: Built with future privacy regulations in mind, offering more granular controls over data collection and retention.
Potential Limitations & Best Use Cases
Steep Learning Curve: Users migrating from Universal Analytics often find GA4’s interface and data model challenging initially.
Report Customization Required: Out-of-the-box reports are fewer than in UA, necessitating custom exploration reports for specific insights.
Best Use Cases: GA4 is essential for any D2C brand or Shopify store that needs a deep, free, and robust platform for understanding customer behavior, optimizing marketing performance, and preparing for future data privacy landscapes. It’s the foundational layer for comprehensive ecommerce analytics.
Hotjar: Understanding User Behavior with Qualitative Insights
Hotjar is a powerful qualitative analytics tool that complements quantitative data by providing visual insights into how users interact with your website. It answers the “why” behind the numbers, showing actual user behavior.
Key Features & How It Complements Quantitative Data
Heatmaps: Visual representations of user clicks, scrolls, and movement on a page, revealing popular and ignored sections.
Session Recordings: Video playback of individual user sessions, allowing you to see exactly how a user navigates, where they struggle, and what prevents them from converting.
Surveys & Feedback Polls: Customizable pop-up surveys and feedback widgets to gather direct input from users at specific points in their journey.
Form Analysis: Identifies which form fields are causing friction or abandonment.
Ideal Scenarios for Hotjar Implementation
Best Use Cases: Hotjar is invaluable for identifying UX issues, understanding user frustration, and validating assumptions drawn from quantitative data. For instance, if GA4 shows a high exit rate on a product page, Hotjar can show *why* users are leaving—perhaps they’re confused by product variants, can’t find shipping information, or are distracted by a pop-up. It’s perfect for optimizing landing pages, product pages, and checkout flows for D2C brands.
Mixpanel: Event-Driven Analytics for Deeper User Journey Understanding
Mixpanel excels at tracking user actions (events) rather than just page views. It’s designed for product teams and marketers who need to understand specific user engagement patterns and optimize funnels for conversion and retention.
Focus on User Actions and Funnels
Event-Based Tracking: Like GA4, Mixpanel focuses on events, but often with a deeper emphasis on custom events related to user interactions within a product or complex web application.
Funnel Analysis: Powerful tools to build and analyze multi-step funnels, identifying drop-off points with precision.
Cohort Analysis: Track the behavior of user groups over time to understand retention and engagement patterns.
User Flows & Journeys: Visualize common paths users take through your site or app.
Why D2C Brands Choose Mixpanel
Best Use Cases: D2C brands with intricate user flows, subscription models, or a strong focus on in-app (or on-site) user engagement find Mixpanel extremely useful. It’s ideal for optimizing specific product features, onboarding flows, or complex customer journeys, and is often favored for its ability to quickly answer “who did what, when, and how often” questions.
Heap: Retroactive Analytics and Auto-Capture Capabilities
Heap offers a unique “auto-capture” approach to data collection, recording every user interaction on your site without requiring manual tagging. This provides a retroactive dataset, allowing you to define events and analyze behavior even for data collected in the past.
Effortless Data Collection for Future-Proof Analysis
Auto-Capture All Data: Automatically records every click, swipe, form submission, and page view, eliminating the need for upfront tagging.
Retroactive Analysis: Define new events or segments at any time and apply them to historical data, preventing data loss from forgotten tags.
Virtual Events: Create complex event definitions (e.g., “add to cart” followed by “view product details”) without writing code.
Behavioral Segmentation: Create highly specific user segments based on their past actions.
Benefits for Rapidly Evolving Shopify Stores
Best Use Cases: Heap is particularly beneficial for fast-growing D2C and Shopify stores with evolving websites and product lines, where data tracking needs might change frequently. Its auto-capture feature saves significant developer time and ensures that no valuable data is missed, making it easy to answer new business questions on demand. It’s excellent for understanding unforeseen user behaviors and rapidly iterating on product and marketing strategies.
Klaviyo: Marketing Automation with Integrated Ecommerce Analytics
Klaviyo is primarily an email and SMS marketing automation platform, but it stands out for its deep integration with e-commerce platforms like Shopify, providing robust customer data and analytics specifically tailored for marketing efforts. This makes it a crucial tool for advanced email marketing automation for e-commerce.
Bridging Marketing and Performance Data
Unified Customer Profiles: Consolidates customer data (purchase history, browsing behavior, email engagement) into rich, individual profiles.
Segmentation: Advanced segmentation based on any customer property or behavior, enabling highly personalized marketing campaigns.
Flows & Automations: Automate personalized email and SMS sequences (e.g., abandoned cart reminders, welcome series, post-purchase follow-ups) triggered by specific events.
Campaign Performance Analytics: Detailed reporting on email open rates, click-through rates, conversions, and revenue generated directly from marketing efforts.
Predictive Analytics: Uses historical data to predict future customer behavior, such as likely churn or next purchase date, informing proactive marketing.
Optimizing Customer Lifecycle for Profitability
Best Use Cases: Klaviyo is indispensable for D2C brands that prioritize customer relationship management, personalized marketing, and driving repeat purchases through email and SMS. Its integrated analytics provide direct insights into how marketing campaigns impact revenue, allowing for continuous optimization of the customer lifecycle and boosting profitability.
Triple Whale: All-in-One Attribution and Profitability Platform for D2C
Triple Whale is a relative newcomer that has rapidly gained popularity among D2C brands, particularly those heavily reliant on paid advertising. It aims to be the “source of truth” for profitability and attribution, consolidating data from various ad platforms, e-commerce platforms, and other tools into a single, intuitive dashboard.
The “Source of Truth” for Ad Spend and ROI
Unified Dashboard: Pulls data from Shopify, Facebook Ads, Google Ads, TikTok Ads, Snapchat, Klaviyo, and more, displaying all key metrics in one place.
First-Party Attribution: Offers various attribution models (e.g., Last Click, Linear, U-shaped) and aims to provide more accurate first-party attribution data, addressing challenges with iOS privacy changes.
Real-time Profitability: Combines revenue with COGS, ad spend, and other expenses to show true profit margins in real-time.
Creative Performance: Helps analyze which ad creatives are performing best across platforms.
LTV & Cohort Reporting: Provides valuable insights into customer lifetime value and cohort performance.
Simplifying Complex D2C Metrics
Best Use Cases: Triple Whale is ideal for D2C brands managing significant ad spend across multiple channels and struggling with fragmented data. It simplifies complex multi-channel attribution and provides real-time profitability insights, allowing marketers and founders to make faster, more confident decisions about their ad budgets and overall growth strategy.
Shopify’s Native Analytics: Essential Insights Within Your Ecosystem
For any merchant running a Shopify store, the platform’s built-in analytics dashboard provides a foundational layer of insights, directly accessible within the Shopify admin. While not as comprehensive as specialized tools, it’s a crucial starting point for online store analytics.
What’s Included and When to Expand
Sales Reports: Detailed reports on total sales, sales by channel, product sales, discount performance, and average order value.
Customer Reports: Overview of new vs. returning customers, customer segments, and customer behavior over time.
Traffic & Behavior Reports: Basic insights into website visitors, traffic sources, top landing pages, and conversion rates.
Marketing Reports: Performance overview of marketing campaigns linked to Shopify.
Finance Reports: Integrates with financial data for a comprehensive view of profit and loss.
Leveraging Core Shopify Reports
Best Use Cases: Shopify’s native analytics are excellent for new or small businesses needing quick access to essential performance metrics without additional cost or complex setup. They provide a solid baseline for understanding daily operations, sales trends, and basic customer behavior. As a business scales and its analytical needs become more sophisticated, integrating with tools like GA4, Hotjar, or Triple Whale becomes necessary to gain deeper, actionable insights and address more complex questions about D2C growth.
Here’s a quick comparison of these top ecommerce analytics tools:
Ecommerce Analytics Tools: Your Ultimate Guide for D2C & Shopify Growth in 2026
By e-comprofits Editorial Team — Senior editors with 10+ years of subject-matter experience. Published 2026-05-26 · Last Updated 2026-05-26
Affiliate disclosure: This article may contain affiliate links. Recommendations are independent and editorially driven.
TL;DR:
Ecommerce analytics tools are indispensable for D2C and Shopify brands, transforming raw data into actionable insights for optimized operations, marketing, and profitability.
Beyond basic traffic, these tools provide deep dives into customer behavior, sales performance, marketing ROI, and operational efficiency, leveraging both quantitative (“what”) and qualitative (“why”) data.
Top tools include GA4, Hotjar, Mixpanel, Heap, Klaviyo, Triple Whale, and Shopify Analytics, each offering unique strengths for different analytical needs and business scales.
Choosing the right stack involves assessing your specific goals, platform (Shopify, headless D2C), budget, and integration needs, moving towards a unified data view for comprehensive insights.
Effective implementation requires a clear tracking plan, continuous optimization through A/B testing, and a proactive approach to addressing challenges like data overload and attribution complexity to unlock sustained e-commerce profit potential.
In the fiercely competitive landscape of 2026, the success of any direct-to-consumer (D2C) brand or Shopify store hinges on its ability to understand and react to data. Gone are the days when guesswork or intuition alone could drive sustainable growth. Today, conversion rate optimization strategies for D2C brands, efficient marketing spend, and superior customer experiences are all fueled by one critical element: sophisticated ecommerce analytics tools. These powerful platforms are the compass guiding online businesses through the vast ocean of customer interactions, sales funnels, and marketing campaigns, revealing pathways to increased profitability and enduring customer loyalty.
This comprehensive guide from e-comprofits is engineered for e-commerce operators, marketers, and founders who are ready to elevate their data strategy. We’ll delve into the nuances of various ecommerce analytics software, explore how they empower businesses to make informed decisions, and provide actionable insights into building an analytics stack that truly drives D2C growth and Shopify optimization. Prepare to transform your approach from simply collecting data to intelligently leveraging it for maximum impact.
The Imperative of Ecommerce Analytics in Today’s Digital Landscape
The digital storefront of 2026 is a dynamic environment, constantly shifting with evolving consumer behaviors, new technological advancements, and increasing privacy regulations. For D2C brands and Shopify merchants, merely existing online is no longer enough; survival and prosperity demand a deep, nuanced understanding of every digital interaction. This is where ecommerce analytics tools become not just beneficial, but absolutely imperative.
Navigating the Complexities of Online Retail
The journey a customer takes from discovery to purchase, and beyond, is rarely linear. It spans multiple devices, channels, and touchpoints. Without precise data, understanding where customers drop off, what motivates a purchase, or which marketing efforts genuinely drive ROI is like navigating a maze blindfolded. Ecommerce analytics provide the visibility needed to decode these complex journeys, identify friction points, and uncover hidden opportunities.
For instance, a D2C brand selling sustainable fashion might initially struggle to understand why their social media campaigns lead to high website traffic but low conversion rates. Robust ecommerce analytics can pinpoint the exact stage in the user journey where users abandon their carts – perhaps a cumbersome checkout process, unexpected shipping costs, or a lack of trust signals on product pages. Without these tools, such critical insights would remain elusive, leading to wasted marketing spend and stagnant growth.
From Data Deluge to Actionable Insights
Every click, scroll, page view, and purchase generates a mountain of data. The challenge isn’t a lack of information, but rather the ability to distill this “data deluge” into actionable insights. This is the core promise of modern ecommerce analytics software. They don’t just present numbers; they contextualize them, revealing patterns, trends, and correlations that would be impossible to identify manually.
Consider an online store experiencing a dip in repeat purchases. Instead of broad assumptions, an advanced analytics tool can segment customers by purchase history, demographics, and engagement levels, revealing that customers who bought a specific product category are less likely to return, perhaps due to a product quality issue or insufficient post-purchase support. This specific, actionable insight empowers the brand to target remedial actions, whether it’s improving a product line or enhancing customer service for that segment.
Ultimately, ecommerce analytics moves businesses beyond reactive problem-solving to proactive strategic planning. It enables D2C brands to anticipate customer needs, personalize experiences, optimize their supply chains, and fine-tune their marketing messages, all leading to a healthier bottom line and a stronger competitive edge in 2026.
What Exactly Are Ecommerce Analytics Tools?
At their core, ecommerce analytics tools are specialized software applications designed to collect, process, analyze, and present data related to online store performance, customer behavior, and marketing effectiveness. They serve as the digital brain of an e-commerce operation, translating raw transactional and behavioral data into digestible, actionable intelligence.
Beyond Basic Traffic: A Holistic View of Your Store
Many people associate “analytics” with simple website traffic numbers – visitors, page views, bounce rates. While these are foundational metrics, modern ecommerce analytics tools go far beyond. They provide a holistic, 360-degree view of an online business, encompassing:
Customer Journey Analysis: Tracking users from their first touchpoint (e.g., an ad click) through their browsing behavior, cart additions, checkout process, and post-purchase engagement.
Sales and Revenue Performance: Detailed breakdowns of product performance, average order value (AOV), lifetime value (LTV), conversion rates at various funnel stages, and profitability by product or segment.
Marketing Campaign Effectiveness: Attribution modeling to understand which channels, campaigns, and keywords drive actual sales and return on ad spend (ROAS).
Website User Experience (UX): Identifying areas of friction, popular content, and navigational patterns to optimize site design and functionality.
Operational Insights: Understanding inventory turns, shipping costs, and refund rates as they relate to overall profitability.
This comprehensive scope allows businesses to connect disparate data points, identifying how, for example, a specific ad campaign impacts product views, which in turn influences add-to-cart rates, and ultimately, overall revenue. It’s about seeing the entire ecosystem, not just isolated components.
[INLINE IMAGE 1: place after second H2 | alt=”ecommerce analytics tools concept illustration”]
The Pillars of Modern Ecommerce Analytics
While the specific features vary between platforms, most robust ecommerce analytics software is built upon several key pillars:
Data Collection: This is the foundation. Tools use tracking codes (like JavaScript snippets, pixels, or server-side APIs) to collect data points about user interactions (clicks, scrolls, form submissions), transactions (purchases, refunds), and user demographics/technology (browser, device, location).
Data Processing & Storage: Raw data is cleaned, structured, and stored in databases, often in real-time or near real-time, making it ready for analysis.
Reporting & Visualization: This is where the magic happens for users. Tools transform complex data into easily understandable dashboards, charts, graphs, and tables. Customizable reports allow users to focus on the metrics most relevant to their goals.
Segmentation: A crucial feature allowing users to divide their audience and data into meaningful groups (e.g., new vs. returning customers, high-value purchasers, users from specific geographic regions) to uncover nuanced behaviors and opportunities.
Funnel Analysis: Visualizing the steps users take to complete a desired action (e.g., product view > add to cart > checkout > purchase) and identifying where users drop off, indicating areas for optimization.
Attribution Modeling: Helping businesses understand which marketing touchpoints contribute to a conversion. This can range from simple last-click attribution to more complex multi-touch models.
Alerts & Anomalies Detection: Proactive notifications when key metrics deviate from expected patterns, allowing for quick identification and response to issues or opportunities.
By leveraging these pillars, D2C brands can move beyond guesswork, making data-driven decisions that enhance customer satisfaction, optimize marketing spend, and ultimately drive sustainable growth and profitability in an increasingly competitive digital marketplace.
Key Metrics and KPIs Unlocked by Robust Ecommerce Analytics Software
Understanding which metrics and Key Performance Indicators (KPIs) to track is as crucial as having the right ecommerce analytics tools. These metrics provide a quantifiable measure of your online store’s health and performance, guiding strategic decisions and pinpointing areas for improvement. Effective online store analytics go beyond surface-level numbers, offering deep insights into every facet of your business.
Sales Performance & Revenue Metrics
These are often the first metrics e-commerce businesses look at, providing a direct snapshot of financial success. However, robust analytics reveal the drivers behind these numbers.
Gross Merchandise Value (GMV) / Total Revenue: The total value of all goods sold over a period. This foundational metric is often segmented by product, category, or customer type.
Average Order Value (AOV): The average amount spent per customer order. Increasing AOV through strategies like upselling, cross-selling, or minimum order free shipping is a common goal.
Conversion Rate (CR): The percentage of website visitors who complete a desired action, typically a purchase. This is a crucial indicator of your site’s effectiveness and is often tracked at various funnel stages (e.g., add-to-cart rate, checkout completion rate).
Customer Lifetime Value (CLTV/LTV): The predicted total revenue a customer will generate throughout their relationship with your business. High LTV indicates strong customer retention and loyalty, a cornerstone of D2C profitability.
Repeat Purchase Rate: The percentage of customers who return to make additional purchases. A high rate signifies customer satisfaction and brand stickiness.
Refund Rate & Return Rate: The percentage of orders that are returned or refunded. High rates can indicate product quality issues, misleading descriptions, or problems with fulfillment.
Gross Profit & Net Profit: While not purely an analytics metric, many advanced tools integrate with financial data to provide an accurate profit picture after COGS, operating expenses, and marketing spend. This is particularly relevant for understanding multi-channel attribution models in e-commerce and their true ROI.
Customer Behavior & Engagement Metrics
These metrics reveal how users interact with your Shopify store or D2C website, offering clues for optimizing user experience and content.
Sessions & Users: The number of visits to your site and the number of unique individuals making those visits.
Page Views & Pages per Session: How many pages users view on average during a session, indicating engagement.
Time on Site / Session Duration: The average length of a user’s visit. Longer durations often correlate with higher engagement.
Bounce Rate: The percentage of visitors who leave your site after viewing only one page. A high bounce rate can signal irrelevant traffic, poor landing page design, or slow loading times.
Exit Rate: The percentage of visitors who leave your site from a specific page, regardless of how many pages they viewed prior. High exit rates on crucial pages (like product pages or checkout steps) indicate points of friction.
Scroll Depth: How far down a page users scroll, indicating content engagement.
Heatmaps & Click Maps: Visual representations of where users click, move their mouse, or focus their attention on a page, providing invaluable qualitative insights.
Funnel Drop-offs: Identifying where users abandon the purchase path (e.g., from product page to cart, or from cart to checkout).
Marketing & Acquisition Efficiency Metrics
These KPIs are vital for optimizing your marketing spend and understanding the true ROI of your campaigns.
Cost Per Acquisition (CPA): The average cost to acquire one new customer. Lower CPA indicates more efficient marketing.
Return on Ad Spend (ROAS): The revenue generated for every dollar spent on advertising. A critical metric for evaluating campaign effectiveness.
Customer Acquisition Cost (CAC): Similar to CPA but often includes all sales and marketing costs, not just ad spend, to acquire a customer. Comparing CAC to LTV is essential for long-term profitability.
Traffic by Channel: Understanding which channels (organic search, paid ads, social media, email, direct) drive the most traffic and, more importantly, the most qualified traffic.
Attribution Models: Analyzing which touchpoints (e.g., first click, last click, linear, time decay) contributed to a conversion, providing a more nuanced view of marketing impact.
Operational & Profitability Metrics
Beyond sales and marketing, ecommerce analytics can shed light on operational efficiency that directly impacts the bottom line.
Inventory Turnover: How quickly inventory is sold and replaced. Slow turnover can tie up capital, while fast turnover indicates popular products.
Shipping Cost Per Order: Tracking this helps optimize shipping strategies and pricing.
Customer Service Interactions Per Order: High numbers can indicate product issues or confusing website information.
By diligently tracking and analyzing these varied metrics with your chosen ecommerce analytics tools, you gain a powerful lens into your D2C or Shopify operation. This data-driven approach allows for targeted improvements, leading to increased customer satisfaction, reduced costs, and ultimately, significantly enhanced profitability.
Types of Ecommerce Analytics Tools: A Categorized Approach
The world of ecommerce analytics is diverse, offering a spectrum of tools designed to address different aspects of online business performance. Broadly, these tools can be categorized by the type of data they specialize in collecting and analyzing: quantitative or qualitative. Understanding this distinction is key to building a comprehensive analytics stack.
Quantitative Analytics Platforms: The “What”
Quantitative analytics tools focus on numbers, statistics, and measurable events. They answer questions like “What happened?”, “How many?”, and “Where?”. These platforms are excellent for identifying trends, measuring performance against KPIs, and understanding user paths on a large scale.
Characteristics:
Numerical Data: Rely on metrics such as page views, clicks, conversion rates, revenue, session duration, bounce rate, etc.
Large Scale: Designed to process and analyze vast amounts of data from thousands or millions of users.
Statistical Analysis: Often include features for segmentation, funnel analysis, cohort analysis, and attribution modeling.
Tracking overall website performance and traffic sources.
Measuring the effectiveness of marketing campaigns (ROAS, CPA).
Identifying popular products, categories, and content.
Detecting conversion funnel drop-offs at a high level.
A/B testing outcomes and statistical significance.
Qualitative Analytics Platforms: The “Why”
Qualitative analytics tools delve into the user experience to understand the motivations, frustrations, and thought processes behind the numbers. They answer questions like “Why did that happen?”, “How do users feel?”, and “What are users trying to achieve?”. These tools provide context and human insight that quantitative data alone cannot offer.
Characteristics:
Behavioral Data: Focus on user actions and perceptions rather than just outcomes.
Visualizations: Often use heatmaps, session recordings, and form analytics.
Direct Feedback: Incorporate surveys, polls, and user interviews.
Smaller Scale: While they can capture data from many users, the analysis is often more granular, focusing on individual user journeys or specific page interactions.
Understanding why users abandon a checkout process (e.g., confusion, trust issues).
Identifying areas of friction on a product page (e.g., unclear CTAs, unread content).
Gathering direct feedback on new features or website changes.
Optimizing forms for better completion rates.
Gaining empathy for the user experience.
[INLINE IMAGE 2: place after fourth H2 | alt=”ecommerce analytics tools comparison illustration”]
All-in-One vs. Specialized Solutions
Beyond the quantitative/qualitative divide, tools also differ in their breadth of features:
All-in-One Platforms: These aim to provide a comprehensive suite of analytics capabilities, often combining aspects of both quantitative and qualitative analysis, alongside marketing automation, attribution, and sometimes even financial reporting. They are appealing for their integrated approach, reducing the need to juggle multiple subscriptions and data sources. Examples include Triple Whale, HubSpot’s CRM Suite, and some enterprise-level platforms.
Specialized Solutions: These tools excel in a particular niche, offering unparalleled depth in their specific area. For instance, a tool like Hotjar is exclusively focused on qualitative user behavior, while a tool like Ahrefs focuses solely on SEO analytics. Many D2C brands build their analytics stack by combining several specialized tools that integrate well, leveraging the “best of breed” for each function.
The optimal analytics strategy for a Shopify store or D2C brand often involves a blend of these tool types. A strong quantitative foundation (like GA4) provides the “what,” while a qualitative tool (like Hotjar) explains the “why.” This combined approach offers a holistic understanding of your customers and business performance, enabling truly data-driven decisions that propel growth and profitability.
Top Ecommerce Analytics Tools for D2C & Shopify Stores (Comparison & Deep Dive)
Choosing the right ecommerce analytics tools is a pivotal decision for any D2C brand or Shopify merchant. The market is saturated with options, each boasting unique features and strengths. Here, we’ll dive into some of the leading platforms, highlighting their core functionalities, ideal use cases, and how they contribute to a robust online store analytics strategy.
Google Analytics 4 (GA4): The Industry Standard for Online Store Analytics
Google Analytics 4 (GA4) represents a significant shift in how Google approaches web and app analytics. Moving from the session-based model of Universal Analytics, GA4 is an event-driven platform designed for a future with less reliance on cookies, offering a unified view of the customer journey across websites and apps. It’s an indispensable tool for deep online store analytics.
Strengths & Key Features
Event-Based Data Model: Every interaction (page view, click, scroll, purchase) is an event, allowing for highly flexible and detailed tracking of user behavior. This is particularly powerful for D2C brands with complex user journeys.
Cross-Platform Tracking: Unifies data from websites and mobile apps into a single property, providing a comprehensive view of the customer lifecycle.
Enhanced Ecommerce Reporting: Offers detailed reports on product performance, sales revenue, checkout behavior, and shopping cart analysis.
AI-Powered Insights: Utilizes machine learning to surface predictive metrics (e.g., churn probability, purchase probability) and automatically detect significant trends or anomalies.
BigQuery Export: For advanced users, GA4 allows free export of raw event data to Google BigQuery, enabling highly customized analysis and integration with other data sources.
Privacy-Centric Design: Built with future privacy regulations in mind, offering more granular controls over data collection and retention.
Potential Limitations & Best Use Cases
Steep Learning Curve: Users migrating from Universal Analytics often find GA4’s interface and data model challenging initially.
Report Customization Required: Out-of-the-box reports are fewer than in UA, necessitating custom exploration reports for specific insights.
Best Use Cases: GA4 is essential for any D2C brand or Shopify store that needs a deep, free, and robust platform for understanding customer behavior, optimizing marketing performance, and preparing for future data privacy landscapes. It’s the foundational layer for comprehensive ecommerce analytics.
Hotjar: Understanding User Behavior with Qualitative Insights
Hotjar is a powerful qualitative analytics tool that complements quantitative data by providing visual insights into how users interact with your website. It answers the “why” behind the numbers, showing actual user behavior.
Key Features & How It Complements Quantitative Data
Heatmaps: Visual representations of user clicks, scrolls, and movement on a page, revealing popular and ignored sections.
Session Recordings: Video playback of individual user sessions, allowing you to see exactly how a user navigates, where they struggle, and what prevents them from converting.
Surveys & Feedback Polls: Customizable pop-up surveys and feedback widgets to gather direct input from users at specific points in their journey.
Form Analysis: Identifies which form fields are causing friction or abandonment.
Ideal Scenarios for Hotjar Implementation
Best Use Cases: Hotjar is invaluable for identifying UX issues, understanding user frustration, and validating assumptions drawn from quantitative data. For instance, if GA4 shows a high exit rate on a product page, Hotjar can show *why* users are leaving—perhaps they’re confused by product variants, can’t find shipping information, or are distracted by a pop-up. It’s perfect for optimizing landing pages, product pages, and checkout flows for D2C brands.
Mixpanel: Event-Driven Analytics for Deeper User Journey Understanding
Mixpanel excels at tracking user actions (events) rather than just page views. It’s designed for product teams and marketers who need to understand specific user engagement patterns and optimize funnels for conversion and retention.
Focus on User Actions and Funnels
Event-Based Tracking: Like GA4, Mixpanel focuses on events, but often with a deeper emphasis on custom events related to user interactions within a product or complex web application.
Funnel Analysis: Powerful tools to build and analyze multi-step funnels, identifying drop-off points with precision.
Cohort Analysis: Track the behavior of user groups over time to understand retention and engagement patterns.
User Flows & Journeys: Visualize common paths users take through your site or app.
Why D2C Brands Choose Mixpanel
Best Use Cases: D2C brands with intricate user flows, subscription models, or a strong focus on in-app (or on-site) user engagement find Mixpanel extremely useful. It’s ideal for optimizing specific product features, onboarding flows, or complex customer journeys, and is often favored for its ability to quickly answer “who did what, when, and how often” questions.
Heap: Retroactive Analytics and Auto-Capture Capabilities
Heap offers a unique “auto-capture” approach to data collection, recording every user interaction on your site without requiring manual tagging. This provides a retroactive dataset, allowing you to define events and analyze behavior even for data collected in the past.
Effortless Data Collection for Future-Proof Analysis
Auto-Capture All Data: Automatically records every click, swipe, form submission, and page view, eliminating the need for upfront tagging.
Retroactive Analysis: Define new events or segments at any time and apply them to historical data, preventing data loss from forgotten tags.
Virtual Events: Create complex event definitions (e.g., “add to cart” followed by “view product details”) without writing code.
Behavioral Segmentation: Create highly specific user segments based on their past actions.
Benefits for Rapidly Evolving Shopify Stores
Best Use Cases: Heap is particularly beneficial for fast-growing D2C and Shopify stores with evolving websites and product lines, where data tracking needs might change frequently. Its auto-capture feature saves significant developer time and ensures that no valuable data is missed, making it easy to answer new business questions on demand. It’s excellent for understanding unforeseen user behaviors and rapidly iterating on product and marketing strategies.
Klaviyo: Marketing Automation with Integrated Ecommerce Analytics
Klaviyo is primarily an email and SMS marketing automation platform, but it stands out for its deep integration with e-commerce platforms like Shopify, providing robust customer data and analytics specifically tailored for marketing efforts. This makes it a crucial tool for advanced email marketing automation for e-commerce.
Bridging Marketing and Performance Data
Unified Customer Profiles: Consolidates customer data (purchase history, browsing behavior, email engagement) into rich, individual profiles.
Segmentation: Advanced segmentation based on any customer property or behavior, enabling highly personalized marketing campaigns.
Flows & Automations: Automate personalized email and SMS sequences (e.g., abandoned cart reminders, welcome series, post-purchase follow-ups) triggered by specific events.
Campaign Performance Analytics: Detailed reporting on email open rates, click-through rates, conversions, and revenue generated directly from marketing efforts.
Predictive Analytics: Uses historical data to predict future customer behavior, such as likely churn or next purchase date, informing proactive marketing.
Optimizing Customer Lifecycle for Profitability
Best Use Cases: Klaviyo is indispensable for D2C brands that prioritize customer relationship management, personalized marketing, and driving repeat purchases through email and SMS. Its integrated analytics provide direct insights into how marketing campaigns impact revenue, allowing for continuous optimization of the customer lifecycle and boosting profitability.
Triple Whale: All-in-One Attribution and Profitability Platform for D2C
Triple Whale is a relative newcomer that has rapidly gained popularity among D2C brands, particularly those heavily reliant on paid advertising. It aims to be the “source of truth” for profitability and attribution, consolidating data from various ad platforms, e-commerce platforms, and other tools into a single, intuitive dashboard.
The “Source of Truth” for Ad Spend and ROI
Unified Dashboard: Pulls data from Shopify, Facebook Ads, Google Ads, TikTok Ads, Snapchat, Klaviyo, and more, displaying all key metrics in one place.
First-Party Attribution: Offers various attribution models (e.g., Last Click, Linear, U-shaped) and aims to provide more accurate first-party attribution data, addressing challenges with iOS privacy changes.
Real-time Profitability: Combines revenue with COGS, ad spend, and other expenses to show true profit margins in real-time.
Creative Performance: Helps analyze which ad creatives are performing best across platforms.
LTV & Cohort Reporting: Provides valuable insights into customer lifetime value and cohort performance.
Simplifying Complex D2C Metrics
Best Use Cases: Triple Whale is ideal for D2C brands managing significant ad spend across multiple channels and struggling with fragmented data. It simplifies complex multi-channel attribution and provides real-time profitability insights, allowing marketers and founders to make faster, more confident decisions about their ad budgets and overall growth strategy.
Shopify’s Native Analytics: Essential Insights Within Your Ecosystem
For any merchant running a Shopify store, the platform’s built-in analytics dashboard provides a foundational layer of insights, directly accessible within the Shopify admin. While not as comprehensive as specialized tools, it’s a crucial starting point for online store analytics.
What’s Included and When to Expand
Sales Reports: Detailed reports on total sales, sales by channel, product sales, discount performance, and average order value.
Customer Reports: Overview of new vs. returning customers, customer segments, and customer behavior over time.
Traffic & Behavior Reports: Basic insights into website visitors, traffic sources, top landing pages, and conversion rates.
Marketing Reports: Performance overview of marketing campaigns linked to Shopify.
Finance Reports: Integrates with financial data for a comprehensive view of profit and loss.
Leveraging Core Shopify Reports
Best Use Cases: Shopify’s native analytics are excellent for new or small businesses needing quick access to essential performance metrics without additional cost or complex setup. They provide a solid baseline for understanding daily operations, sales trends, and basic customer behavior. As a business scales and its analytical needs become more sophisticated, integrating with tools like GA4, Hotjar, or Triple Whale becomes necessary to gain deeper, actionable insights and address more complex questions about D2C growth.
Here’s a quick comparison of these top ecommerce analytics tools: