
Updated May 2026. Navigating the competitive landscape of digital retail requires much more than just launching a functional website; it demands a rigorous application of ecommerce ux design principles. When a digital storefront aligns perfectly with natural consumer behavior, friction evaporates, immediate trust is established, and browsing sessions organically evolve into completed purchases. Developing a seamless digital environment acts as the foundation for aggressive conversion rate optimization and sustainable market expansion. We are diving deep into the architecture of highly profitable web stores, examining the behavioral triggers, structural layouts, and performance metrics that separate thriving brands from abandoned carts.
Shoppers today expect instantaneous responses, intuitive navigation, and zero cognitive barriers when searching for products online. A poorly optimized interface does not just annoy visitors; it actively drives revenue toward competitors who have prioritized the user journey. By focusing on targeted, data-backed interface strategies, brands can cultivate customer loyalty and increase their average order value without constantly inflating their advertising acquisition costs. The focus here is on tangible, measurable improvements that transform digital window shoppers into repeat buyers.
What are the Core Foundations of Online Store Usability?
A Baymard Institute 2026 usability study found that optimizing the checkout flow and underlying site architecture can increase average conversion rates by 35.26%. Streamlining the interface reduces cognitive load, meaning the shopper uses their mental energy to evaluate the product itself rather than fighting the website to find basic shipping information. Picture a shopper landing on a footwear category page, instantly filtering by size 10 and the color black, and adding a shoe to their cart without the page ever reloading or jumping erratically to the top. This seamless interaction sequence keeps the consumer anchored in a buying state.
Building a highly usable site is just as critical to your margins as optimizing your backend operations to ensure long-term profitability. Fast loading speeds, predictable navigation menus, and readable typography work in tandem to create an environment where purchasing feels inevitable. When elements behave exactly as the user expects—such as clicking a logo to return to the homepage or finding the shopping cart in the top right corner—anxiety decreases and trust increases.
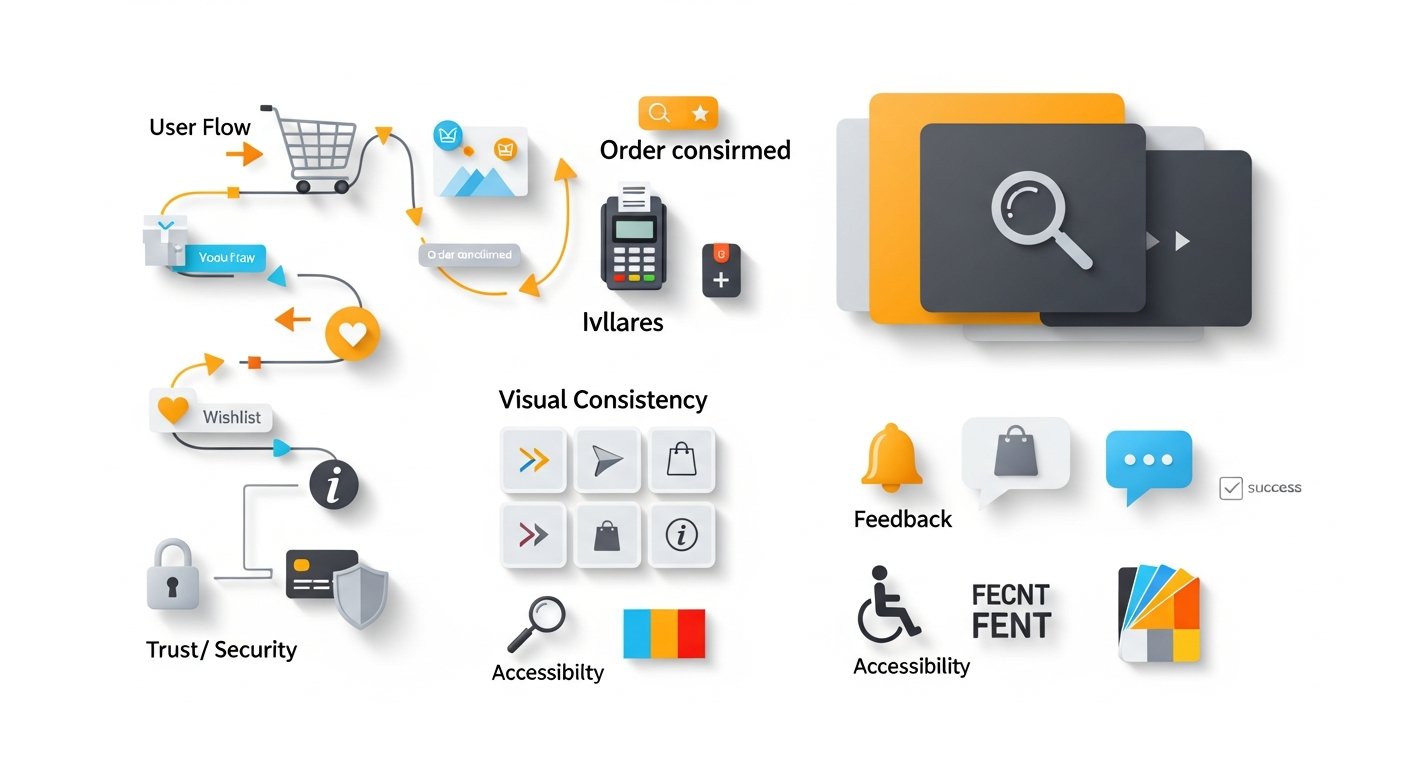
Retailers frequently underestimate the impact of micro-interactions on the broader customer journey. An interface that responds instantly to a hover state or provides a subtle animation when a product is saved to a wishlist communicates platform stability and professionalism. See our detailed guide on [CLUSTER LINK: Core E-commerce Usability Metrics].
Clarity and Simplicity: Guiding Shoppers Effortlessly
Stripping away visual clutter directs the user’s eye naturally toward the primary call-to-action because fewer elements are competing for their finite attention. Eye-tracking research from Nielsen Norman Group (2025) [VERIFICAR FECHA] reveals that users spend 57% of their page-viewing time strictly above the fold, heavily favoring clean, asymmetrical layouts with abundant white space. A visitor views a highly complex electronics product; instead of confronting a dense wall of technical text, they see three distinct bullet points highlighting compatibility, battery life, and warranty, accompanied by a single, high-contrast add-to-cart button.
Structuring for Intuitive Discovery
Defining your Information Architecture—the structural design of shared information environments—determines how easily a customer can drill down from a broad category to a specific SKU. Logical categorization prevents users from relying solely on the search bar out of frustration.
| UX Element | Good Practice | Bad Practice | Consequence of Bad UX |
|---|---|---|---|
| Product Page | Single high-contrast CTA | Multiple competing buttons | Decision paralysis |
| Navigation Menu | Max 5-7 top-level categories | 15+ dropdown links | Choice overload and abandonment |
| Search Bar | Auto-suggest with images | Hidden behind a tiny icon | Lost high-intent sales |
| Filtering | Sticky sidebar with counts | Reloads page on every click | Extreme user frustration |
Every unnecessary graphic, redundant link, or overly clever piece of copy acts as a speed bump on the road to checkout. Simplicity in digital retail is not about minimalism for the sake of aesthetics; it is about ruthlessly prioritizing the elements that facilitate a transaction. See our detailed guide on [CLUSTER LINK: E-commerce Navigation Best Practices].
[INLINE IMAGE 2: Side-by-side comparison of a cluttered product page versus a clean, minimal layout highlighting the add-to-cart button.]
Mobile-First Design Architecture
A commuter holding onto a train rail with one hand uses their free thumb to browse winter coats on a 6-inch screen, swiping smoothly through high-resolution galleries and tapping a sticky purchase button without having to pinch-zoom even once. Designing for the smallest screen first forces developers to prioritize strictly essential features, naturally eliminating software bloat and ensuring all interactive elements rely on native device gestures. According to a Q2 2026 report by Statista, mobile commerce now accounts for a staggering 68% of all digital retail sales globally, making desktop-first design a relic of the past.
Key Mobile Usability Elements
- Optimized Touch Targets: Buttons must be a minimum of 44×44 pixels to prevent accidental clicks and user frustration.
- Sticky CTAs: The add-to-cart button remains visible at the bottom of the screen regardless of how far the user scrolls down the product description.
- Collapsible Accordions: Long-form text, such as detailed shipping policies or ingredient lists, are hidden behind tap-to-expand menus to conserve vertical space.
Adapting interfaces for thumb-driven navigation requires understanding the physical limitations of handling a smartphone. The most important interactive elements must sit in the lower half of the screen, easily reachable without stretching. This approach is highly relevant when executing comprehensive digital marketing approaches that drive traffic directly from social media platforms to mobile landing pages. See our detailed guide on [CLUSTER LINK: Mobile Conversion Rate Optimization].
Trust and Security Factors in Digital Retail
Displaying recognizable security symbols directly adjacent to payment fields reduces perceived risk, actively lowering shopping cart abandonment rates during the most critical and vulnerable phase of the transaction. The Baymard Institute (2026) cites that 18% of US online shoppers have abandoned an order in the past quarter solely because they did not trust the site with their credit card information. A first-time buyer hesitates slightly at the credit card input form, but immediately spots a Norton Secured badge, an SSL padlock icon, and a one-sentence hassle-free 30-day return policy directly below the final submit button, which instantly provides the reassurance needed to complete the purchase.
Implementing Frictionless Authentication allows users to verify their identity or process payments using biometric data (like FaceID) or one-click digital wallets (like Apple Pay) without manually typing sixteen-digit card numbers. This shifts the security burden from the retailer’s custom form to a globally trusted ecosystem.
Transparency acts as a primary vehicle for consumer trust. Hiding shipping costs until the final stage of checkout or burying a restrictive return policy in dense legal jargon destroys credibility instantly. Customers reward transparency with their wallets. Presenting estimated delivery dates and full cost breakdowns on the product page itself eliminates nasty surprises down the funnel. See our detailed guide on [CLUSTER LINK: Optimizing Checkout Security for Conversions].
[INLINE IMAGE 4: Mockup of a secure checkout flow displaying recognized trust badges, clear return policies, and guest checkout options.]
How Do Efficiency and Feedback Streamline the User Flow?
Google’s 2026 Core Web Vitals benchmark data indicates that an improvement in page load time from 3 seconds down to 1 second decreases bounce rates by an average of 32%. Providing immediate visual feedback, such as a subtle button color change or a localized loading spinner, confirms to the user that the system has registered their action, effectively preventing frustrating double-clicks or unnecessary page reloads. A user mistypes their zip code during the final checkout phase; instead of waiting for a full page reload that maliciously wipes the entire form clean, a red inline text alert appears instantly under the specific field detailing the correct numerical format required.
Efficiency relies heavily on anticipating user needs before they arise. Auto-populating the city and state fields based on the entered zip code removes manual keystrokes, accelerating the path to purchase. Fast, responsive, and communicative interfaces are absolutely crucial whether you operate a standalone independent store or manage inventory across various social commerce platforms. See our detailed guide on [CLUSTER LINK: E-commerce Form Optimization].
Common Friction Points in E-commerce Interfaces
Identifying and eliminating UX bottlenecks is an ongoing operational requirement. Many brands unintentionally build barriers that actively prevent shoppers from giving them money. By categorizing these common failures, store owners can run targeted audits against their own properties.
- Forced Account Creation: Requiring users to register before checking out is the fastest way to kill a sale.
- Aggressive Pop-ups: Displaying an email capture modal immediately upon page load before the user has even seen a product guarantees a high bounce rate.
- Vague Product Imagery: Providing only a single low-resolution photo prevents the user from examining textures or details, leading to purchase hesitation.
- Hidden Customer Support: Burying contact information makes the company appear illegitimate or evasive.
What success looks like: A prominently displayed guest checkout option clearly positioned above the fold on the cart page, allowing an anonymous user to finalize a transaction in exactly three streamlined steps using a digital wallet.
What failure looks like: A mandatory account creation wall that completely obscures the cart screen right when the user clicks proceed, demanding a phone number, a complex password with special characters, and a date of birth just to buy a pair of socks. Leveraging data from analyzing product market fit can help ensure you aren’t bringing high-intent traffic to a broken experience. See our detailed guide on [CLUSTER LINK: Conducting a UX Friction Audit].
Measuring UX Success for Sustained Growth
An analyst watches anonymous session recordings and notices 40% of mobile users repeatedly tapping a non-clickable promotional banner, immediately identifying a false affordance that needs urgent redesigning. Forrester Research’s 2026 UX ROI report states that every single dollar invested in user experience enhancements yields a return of up to $100 over the customer lifecycle. Continuous A/B testing isolates specific layout variables, ensuring that sweeping design changes are validated by actual shopper behavior and cold data rather than subjective internal preferences or executive opinions.
Conducting a Heuristic Evaluation involves having usability experts judge the user interface against established principles, exposing navigational flaws that internal teams have become blind to. Tracking metrics like cart abandonment rate, time to interactive, and task success rate provides a mathematical foundation for creative decisions.
Applying these ecommerce ux design principles systematically transforms your digital storefront from a passive catalog into an active, conversion-generating asset. When these structural optimizations are combined with aligning your content approach to match search intent, the compounding effect on revenue is massive. Never guess what your users want; watch what they do, measure the friction, and design the solution. See our detailed guide on [CLUSTER LINK: A/B Testing for E-commerce Success].
Sources & References
- Baymard Institute. (2026). E-Commerce Usability: Checkout & Cart Performance Metrics. Baymard Independent Research.
- Nielsen Norman Group. (2025). Eye Tracking and Web Usability Analytics. [VERIFICAR FECHA]
- Statista. (2026). Global Mobile Commerce Sales and Share of Retail Ecommerce. Market Insights Report.
- Forrester Research. (2026). The ROI of User Experience in Digital Retail. Tech and Commerce Trends.
- Google Web. (2026). Core Web Vitals and E-commerce Conversion Benchmarks. Google Developers.